
The field of particle size distribution (PSD) characterization and measurement has experienced a renaissance over the past 40 years. These changes have been driven by advances in electronics, computer technology, and sensor technology in conjunction with the market pull for PSD methods embodied in cost-effective, user-friendly instrumentation. These changes can be characterized by at least four activities: (1) End user innovation exemplified by techniques such as hydrodynamic chromatography (HDC), capillary hydrodynamic fractionation (CHDF), and field flow fractionation methods (sedimentation, flow, and thermal fields, respectively SdFFF, FIFFF, and ThFFF); (2) Revitalization of older instrumental methods such as gravitational and centrifugal sedimentation; (3) Evolution of research-grade instrumentation into low-cost, routine, user-friendly instrumentation exemplified by dynamic light scattering (DLS); and (4) The attempt to meet extremely difficult technical challenges such as: (a) providing a single hybrid instrument with high resolution over a very broad dynamic range (4+ decades in size; e.g., Fraunhofer/Mie; photozone sensing/DLS); (b) PSD measurement of concentrated dispersions (acoustophoretic, dielectric measurements, fiber optic DLS (FOQELS); (c) in-situ process particle size sensors (in-line or at-line, e.g., FOQELS); (d) routine measurement of particle shape and structure (e.g., image analysis). Instrumental methods resulting from these activities are discussed in terms of measurement principles and the strengths and weaknesses of these methods for characterizing PSDs. Business and societal driving forces will impact customer perceived instrumentation and knowledge needs for the future and the ability to meet the specific difficult technical challenges in particle size distribution characterization mentioned above. Anticipated progress toward meeting these technical challenges in particle size distribution characterization mentioned above is discussed.
Introduction
Over the last 40-plus years, newer coatings technologies, such as high solids, powder, waterborne, and radiation-curable coatings have had significant market share growth. These coatings technologies have been developed to meet the challenges of: (a) governmental regulations in the areas of ecology (volatile organic compounds (VOC) emission); (b) long-term increasing costs of energy and petroleum based solvents; (c) more active public consumerism; and (d) the continual need for cost-effective high-performance coatings in a highly competitive and global business environment. These new coatings technologies require the use of water as the major solvent with water-soluble or high molecular weight latex polymers or the use of strategically designed low-molecular weight polymers, oligomers, and reactive additives which, when further reacted, produce high molecular weight and crosslinked polymers. This has led to a need for improved methods of materials characterization in diverse areas, which include molecular weight distribution analysis, particle size distribution (PSD) measurement and assessment and characterization, rheology of coatings, film formation and cure process characterization, morphological surface and bulk characterization, and spectroscopic analysis, as well as a need for improved methods for modeling and predicting materials properties and processes.
Concurrent with the major technological changes in the coatings industry was the significant increase in the rate of change in instrumentation technology. This change was driven by significant advances in electronics and computer and sensor technologies to produce computer-aided, more user-friendly, reliable, and cost-effective instrumentation. The advances in instrumentation and computer technology are filling the need for improved polymer and coatings characterization methods in the context of the newer coatings technologies.
The newer coatings technologies have driven the need for improved methods of PSD assessment and characterization for each of the coatings technologies in terms of size ranges and component particulates as follows:
Waterborne coatings (0.01–50 mm)
- Latex
- Pigments (size and shape)
- Emulsions and dispersions
Powder coatings (0.1–100 mm)
- Resin-pigment composite particle:
(a) dry powder;
(b) wet concentrated dispersions - High solids
- Pigment grind particle size analysis (0.1–100 μm)
The particle size assessment and characterization needs resulting from the challenges presented by the newer coatings technologies and their component materials leads to the following measurement requirements:
- Wide dynamic particle size range
- Improved resolution
- Measurements made in the concentrated dispersion regime
- Assessment of dispersion stability
- Description of structural and textural morphology
The changes in the field of PSD characterization and measurement, aided by the advances in electronics computer
and sensor technologies, can be characterized by at least
four activities:
- End user innovation
- Revitalization of older instruments
- Evolution of research grade instrumentation into
low-cost, user-friendly instrumentation - Attempts to meet extremely difficult technical challenges
The advances in PSD measurement methods will be discussed in the context of the four above-mentioned activities in terms of measurement principles and the strengths and weaknesses of these methods for characterizing PSDs.
End User Innovation—Commercial Development
The first activity in the changes in PSD characterization and measurement is the commercial development of instrumental methods originally developed in a few academic and industrial laboratories by individuals with high levels of skill and expertise. Innovations in instrumentation and methods usually are driven by the customers who are the technological and scientific leaders and prototype developers, while the instrument vendors are the technological followers who have the engineering skills to do cost-effective commercial development. Examples of such methods are hydrodynamic chromatography (HDC), capillary hydrodynamic fractionation (CHDF), and field flow fractionation methods involving the use of sedimentation, flow, and thermal fields (e.g., SdFFF, FIFFF, and ThFFF).
Hydrodynamic Chromatography (HDC)
HDC, first reported in 1976, was invented in an industrial laboratory by Hamish Small1 to fulfill an analysis need of The Dow Chemical Company. It took 10 years to be transferred from a laboratory method requiring a high degree of skill into a commercial instrument requiring a moderate degree of skill. The commercialization was carried out by Micromeritics Corporation. However, the commercialization failed in the marketplace because of technological limitations inherent in the method and because of competitive market pressures.
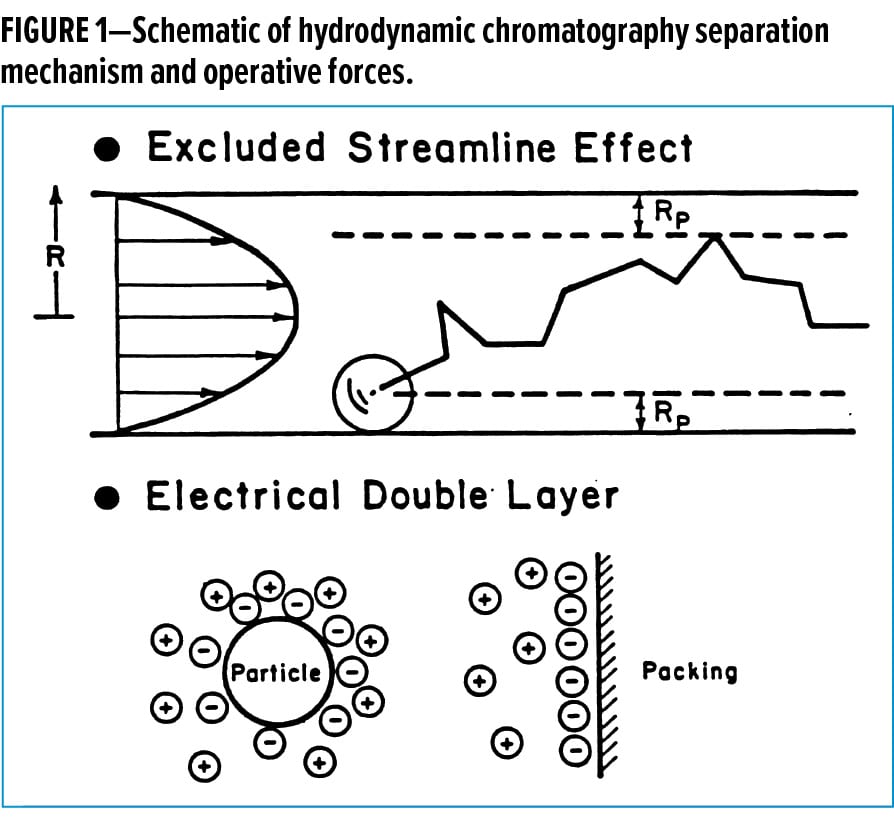
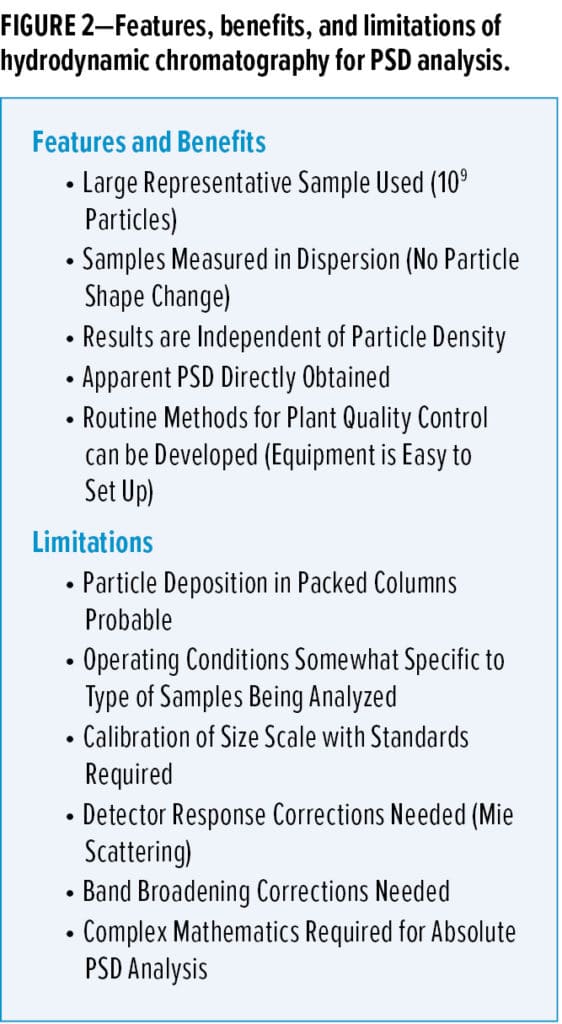
HDC instrumentation is comprised of a liquid chromatograph with an accurate and precise pumping system. Detection was accomplished with a sensitive fixed wavelength ultraviolet (UV) detector. Fractionation and separation of particles occurred in a column packed with uniform, non-porous beads. The separation of particles by size took place in the interstices between the beads and was primarily a function of the bead size and the ionic strength of the medium. The separation mechanism is shown in Figure 1. The interstices between the beads can be treated as capillaries of varying sizes. Larger particles ride higher up on the parabolic flow profile and are eluted first while some smaller particles hug the walls of the capillary experiencing slower flow streamlines and exit later. Other contributing factors to the separation mechanism include electrical double layer effects and Van der Waals attraction. The fatal technical flaw in the methodology was the unpredicted occurrence and amount of particle deposition, which took place in the packed columns. The overall features, benefits, and limitations of this methodology are shown in Figure 2.
Capillary Hydrodynamic Fractionation (CHDF)
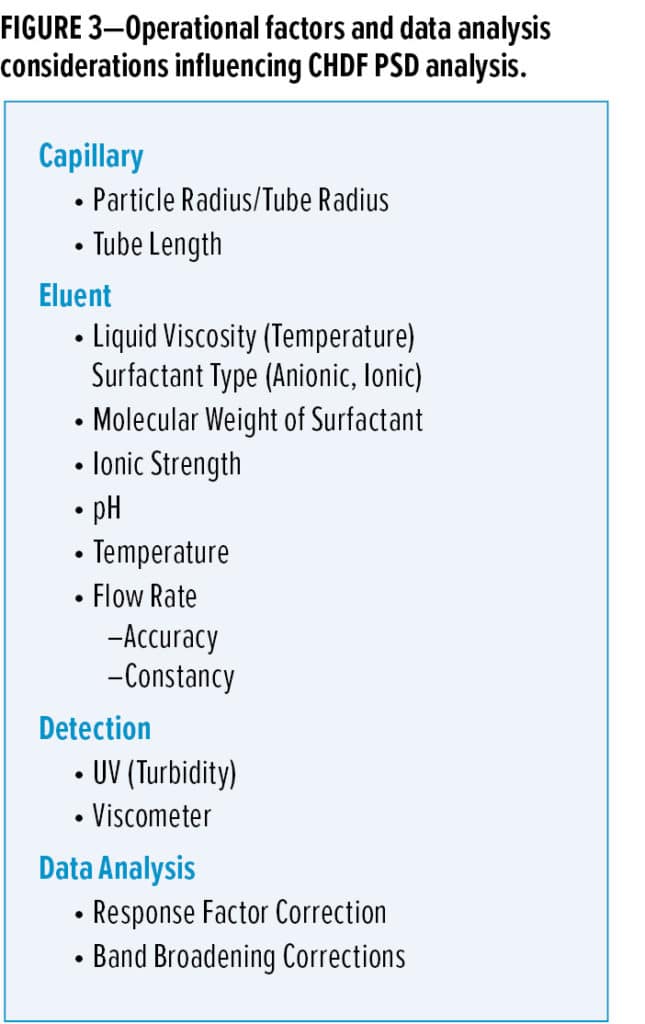
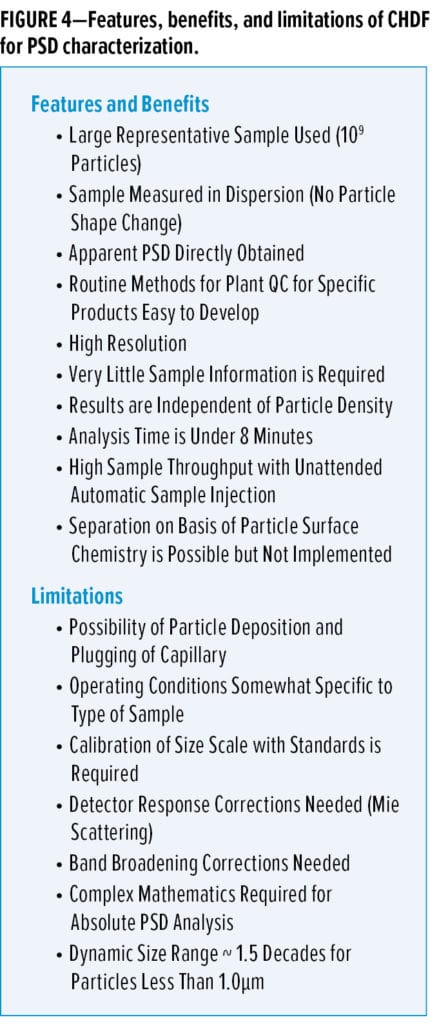
The “Tubular Pinch Effect” mechanism operative in CHDF was first discovered by Segre and Silberberg2 in 1962 and applied to particle size analysis in 1979 by Regnier and Ball3. However, it did not develop into a viable commercial instrument until innovative experimental and theoretical work was carried out by Silebi and Dos Ramos.4,5 The commercial embodiment of CHDF had become available from MATEC Applied Sciences. CHDF instrumentation is quite analogous to HDC in that a liquid chromatograph with precise, accurate, and reproducible flow is required. In this instrument, the separation does take place in capillaries of defined dimension using split-flow injection. The mechanism of this separation method is essentially the same as that postulated for HDC. However, now the column is an empty capillary, so there is much less propensity for the particles to deposit in the column. The factors influencing the particle size fractionation are shown in Figure 3, and the associated features, benefits, and limitations of CHDF are shown in Figure 4.
Field Flow Fractionation (FFF)
Field Flow Fractionation methods were invented by J. Calvin Giddings and co-workers and reported in 1967.6-7 The technology transfer of FFF methods from an academic laboratory method to viable commercial instrument has taken a minimum of 20 years to occur. The DuPont Instrument Company commercialized a sedimentation FFF instrument (SdFFF) in 1986 based upon the pioneering work of J. Calvin Giddings and the subsequent research of Kirkland and Yau.8 Unfortunately, the DuPont Instrument Company’s SdFFF instrument was a commercial failure and unavailable by 1991. However, a small entrepreneurial company known as Fractionation, Inc. began making SdFFF instruments commercially available in 1988, followed by FIFFF (flow FFF) instruments in 1991 and, more recently, ThFFF (thermal FFF) instruments.
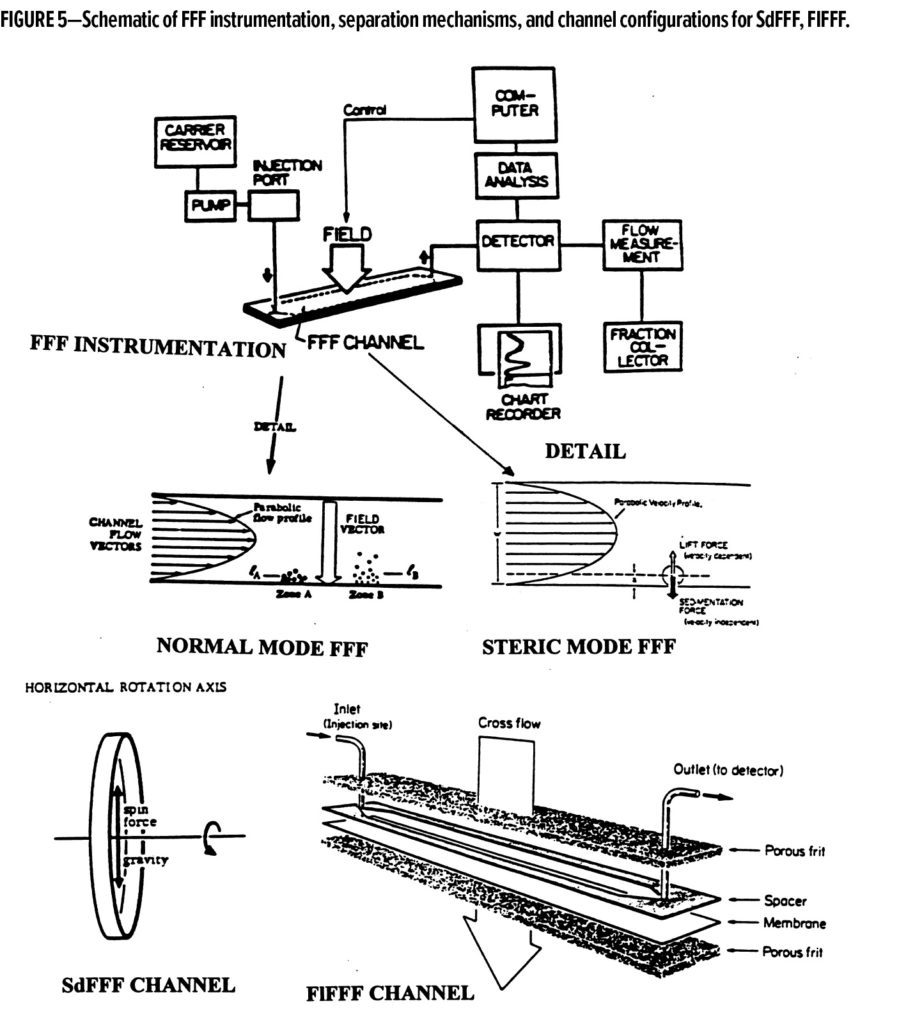
Field flow fractionation is a form of one-phase chromatography. The instrument is a liquid chromatographic system in which the separation takes place in a flat, narrow channel (typically 100 to a few hundred micrometers in width). A parabolic flow profile is created in this narrow channel by the mobile phase. An external field is applied across the face of the channel such that the field extends over the channel’s thin dimensions and is perpendicular to the flow field. Particles are driven toward the accumulation wall of the channel and form a diffuse cloud, which has an exponential concentration distribution as a result of Brownian motion acting against the field. For particles less than 1–2 µm, smaller particles are displaced farther from the accumulation wall. When the flow field is turned on, the smaller particles, which ride higher on the parabolic flow profiles elute first. The fields that have been used include SdFFF, ThFFF consisting of a temperature gradient across the channel walls, cross flow (FIFFF), electric (ElFFF), and magnetic (MFFF). Commercial instruments are available to perform SdFFF, ThFFF, and FIFFF.
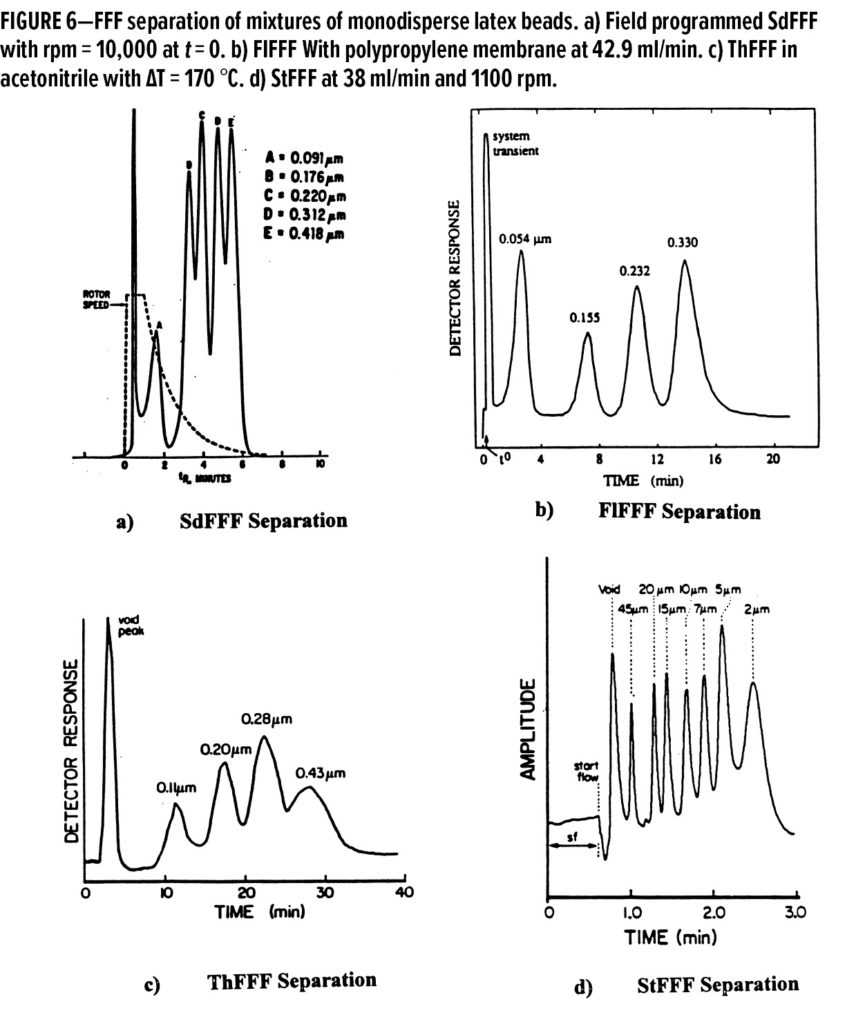
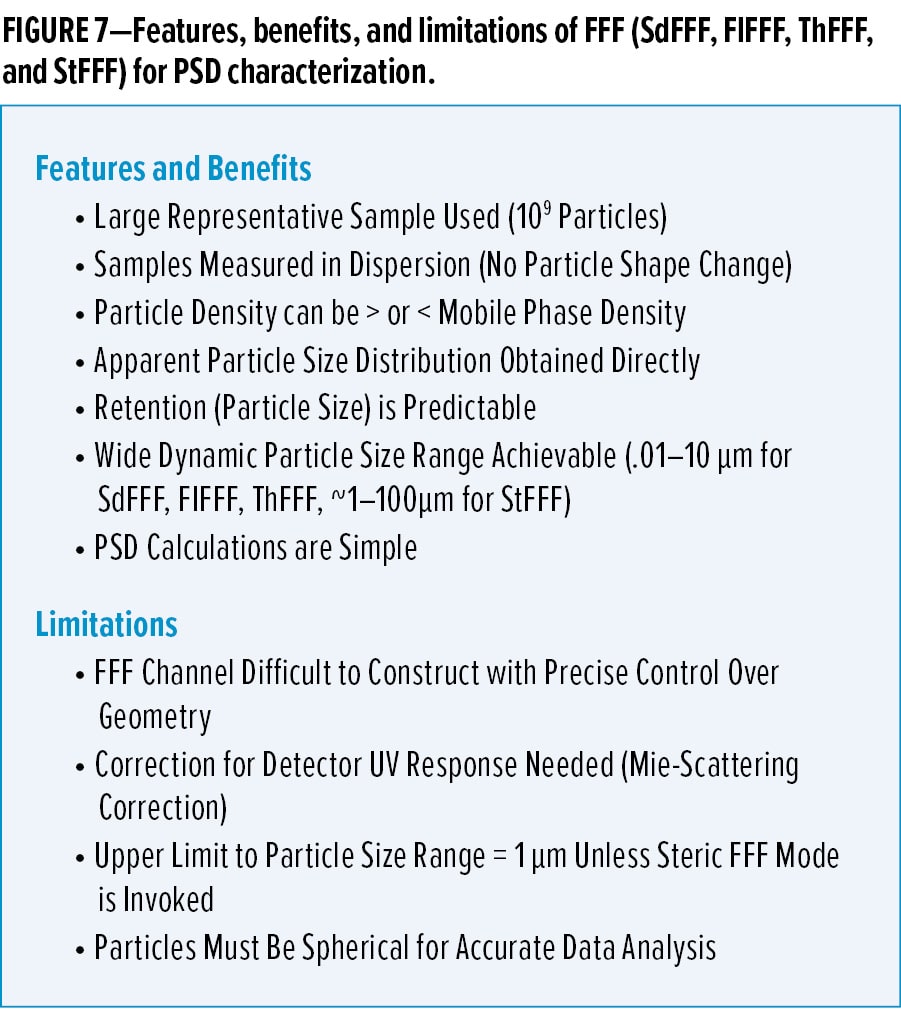
A schematic of the instrumentation separation mechanism and some channel configurations are shown in Figure 5. When the particles are greater than 1 µm, effects of Brownian motion become negligible, and the larger particles ride higher on the parabolic flow streamlines because the velocity-dependent lift forces increase relative to the driving forces produced by the perpendicular external field. In the ~1–100 µm size range, the larger particles elute first, analogous to CHDF. This mechanism is termed the steric mode of FFF (StFFF). In the commercially available instrumentation, field programming options are available for extending the size separation range, reducing the analysis time and optimizing the resolution per unit of time. Examples of separation by SdFFF, FIFFF, ThFFF, and StFFF are shown in Figure 6. The features, benefits, and limitations of FFF chromatography methods are shown in Figure 7. For a review of FFF applied to particle characterization, the reader is referred to the many papers and review articles of Giddings and co-workers.9
The commercialization of the instrumental techniques of HDC, CHDF, and FFF have attempted to address the market pull by many industries for PSD analysis methods, primarily in the 0.01–1.0 µm size range. The coatings industry material characterization needs, as a result of the growth of waterborne coatings technology for improved particle size distribution analysis of latex, pigments, and emulsions, is a component of the overall market pull for these techniques.
Revitalization of Older Instrumental Methods
Gravitational and Centrifugal Sedimentation
The second activity in the renaissance of PSD characterization and measurement is characterized by the revitalization of older instrumental methods such as gravitational and centrifugal sedimentation methods. Redesign, modernization with advanced electronics, and user-friendly computer-aided analysis have extended the instrument product life cycle. A good example is disc centrifuge photosedimentometry (DCP).10,11 The basic technology has been around since the late 1950s and was embodied into a commercial instrument in the 1960s by the Joyce Loebel Company. During the 1970s, the Joyce Loebl Disc Centrifuge Photosedimentometer was the only commercially available instrument for obtaining PSD information by the DCP technique. This technique was particularly well suited for the particle size analysis requirements of the coatings industry for the analysis of latexes, pigments, and emulsions.12-14 However, it had deficiencies that made it unsuitable as a plant quality control instrument. Over a period of about 10 years, industrial scientists at The Glidden Company developed an improved instrument11, method of use15,16 and user-friendly data analysis system. The Glidden Company’s DCP technology was licensed to the Brookhaven Instruments Corporation in 1986, which made additional engineering improvements and successfully commercialized the enhanced and revitalized DCP technology. The current instrument can operate in both the line start and homogeneous start modes.
In addition, Brookhaven Instruments Corporation extended the technology by developing an X-ray detection system that facilitated the analysis of heavy small inorganic particles. The X-ray disc centrifuge photosedimentometer (X-DCP) became commercially available in 1991 and was based upon a prototype developed by Terry Allen at DuPont. The X-DCP can operate both in the gravitational and sedimentation modes.
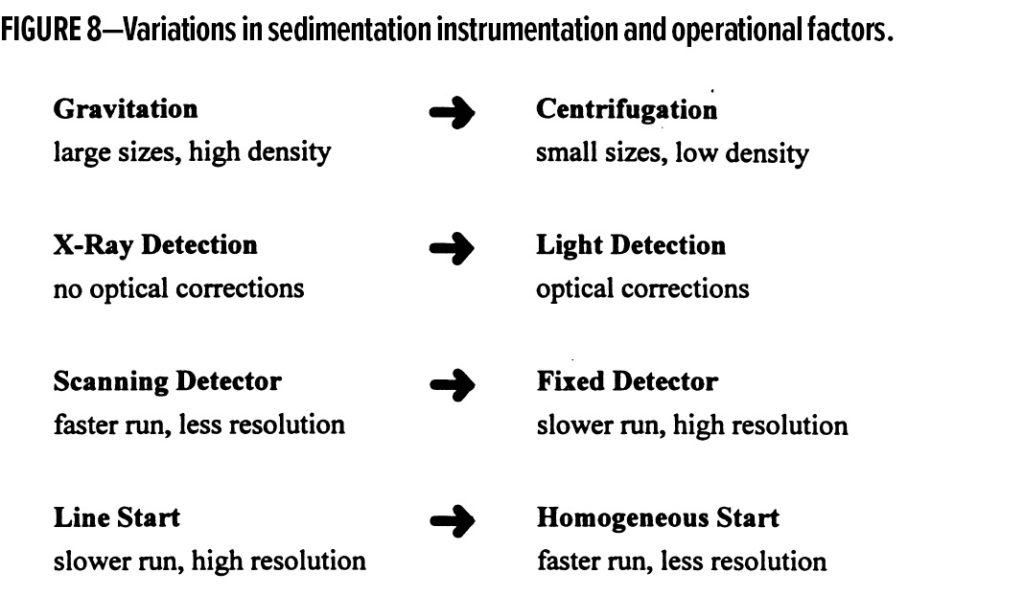
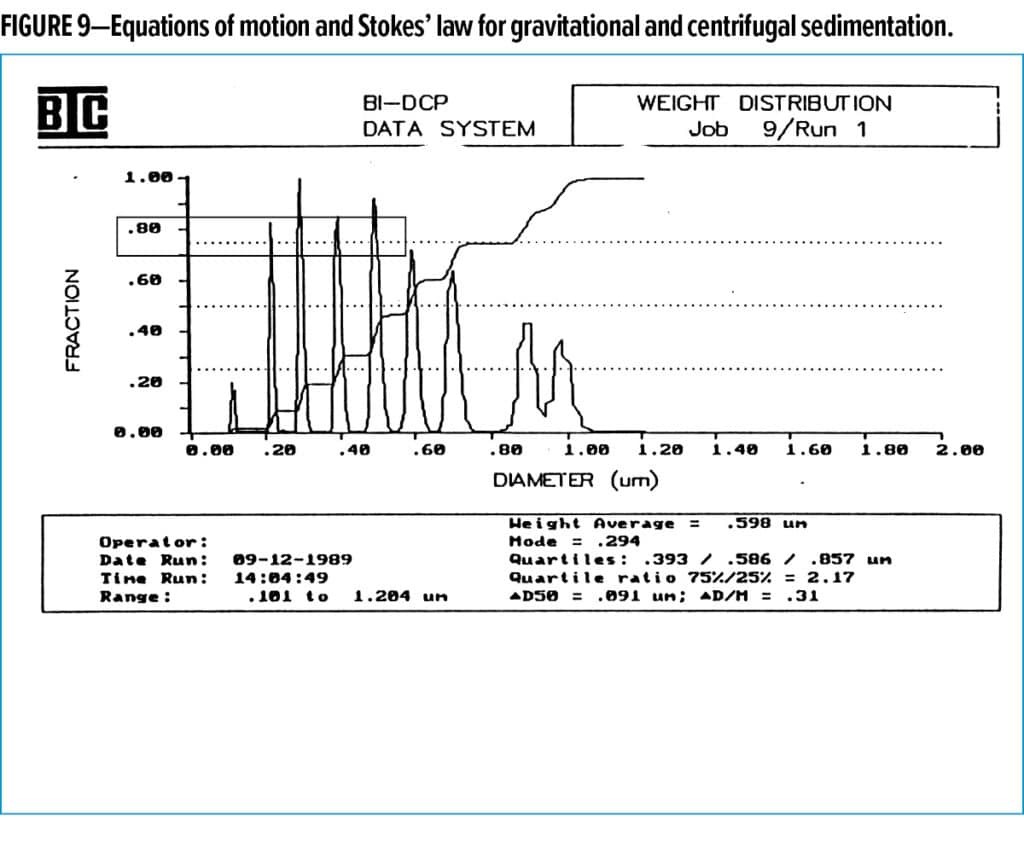
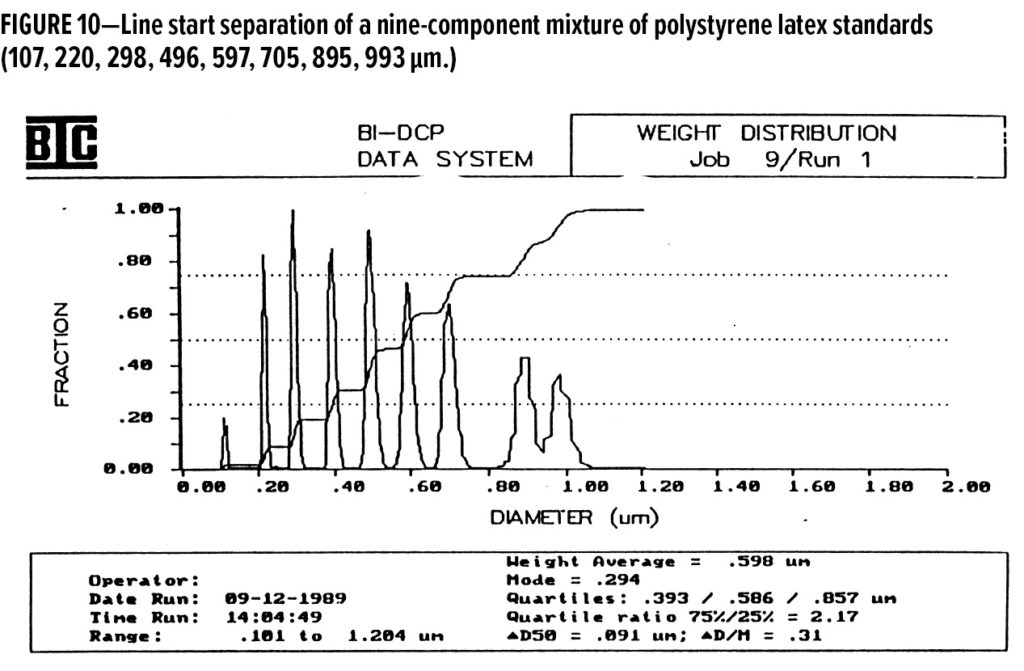
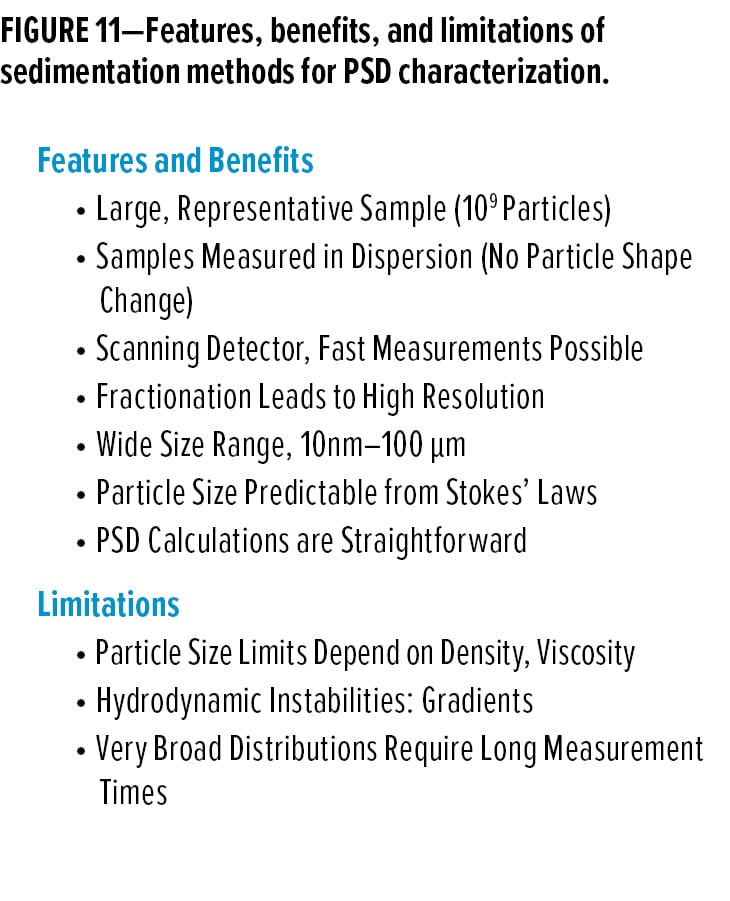
The range of variations in sedimentation instrumentation mode, detection, and experimental method is shown in Figure 8. Also shown in Figure 9 are Stokes’ laws for gravitational and centrifugal sedimentation, which govern the fractionation of particles by size in a gravitational or centrifugal force field. The line start mode11,12 can produce very high resolution separations. An example of such a separation is shown in Figure 10 for a mixture of nine Duke polystyrene latex standards covering a size range of 107–993 nm in approximately 100-nm increments. Baseline resolution was achieved in seven out of the nine standards. Another major advance in the method of operation is protecting the aqueous meniscus from evaporative cooling and disruption of the density gradient in the fluid by sealing the surface with a small amount of dodecane (usually 1 ml of n-dodecane, injected a few minutes after the density gradient has formed, in about 15–20 ml of an aqueous spin fluid). The sealing of the fluid surface inhibits evaporative cooling and thereby maintains a stable density gradient for several hours and extends the analysis size range. The homogeneous start mode is faster, covers a wider dynamic size separation range, but has less resolution than the line start mode for multi-modal separations. The features, benefits, and limitations of sedimentation methods are shown in Figure 11.
An instrument designed for particle size analysis by sedimentation in a gravitational field was patented by Oliver, Hicken, and Orr and commercially embodied, in 1969, by Micromeritics into an instrument known as the Sedigraph. This instrument produces a cumulative distribution of particle sizes and has been used heavily for the analysis of pigments such as titanium dioxide. Starting in 1988, the Sedigrap’s design and function were revitalized by adding an automatic sample introduction system for unattended operation as well as improving the data analysis system.
Evolution of A Research Instrument Into A Routine User-Friendly Instrument
Dynamic Light Scattering (DLS, PCS, QELS)
The third activity is the evolution of a research instrument into a low-cost instrument that requires a minimum degree of skill to use. An excellent example of this process is the transformation of research-grade photon correlation spectrometers into low-cost, easy to use, limited-function instruments for routine analysis applications.
Dynamic light scattering (DLS) was first known as quasielastic light scattering (QELS) derived from the fact that when photons are scattered by mobile particles, the process is quasielastic. This gave rise to the acronym DLS, since QELS gave information on the dynamics of the scatterer. Since measurements are made with a digital correlator, the acronym PCS (photon correlation spectroscopy) is widely used. The first QELS measurements were made in 1964 by Cummins et al.17 The first commercial instruments were available circa 1976 and only suitable for use by experts. The early measurements were concerned with obtaining translational diffusion coefficients of macromolecules and particles. The technique was used to gain information about particle size by relating the diffusion coefficient to particle size through the Stokes Einstein equation for spheres.18
By the early 1970s, the fundamentals had been established. From the mid-1970s onward, improvements occurred in the technology for digital autocorrelators as well as in automation and integration of advances in microprocessors and laser technology. From the early 1980s onward, the PCS instrumentation was increasingly used for particle size analysis. By 1985, low-cost routine 90° instruments were commercially available for routine analyses. The PCS instrumentation was made more automatic and useful for the analysis of particle size and estimating PSD with the commercialization of an automatic sample dilution system invented by Nicoli and Elings.19
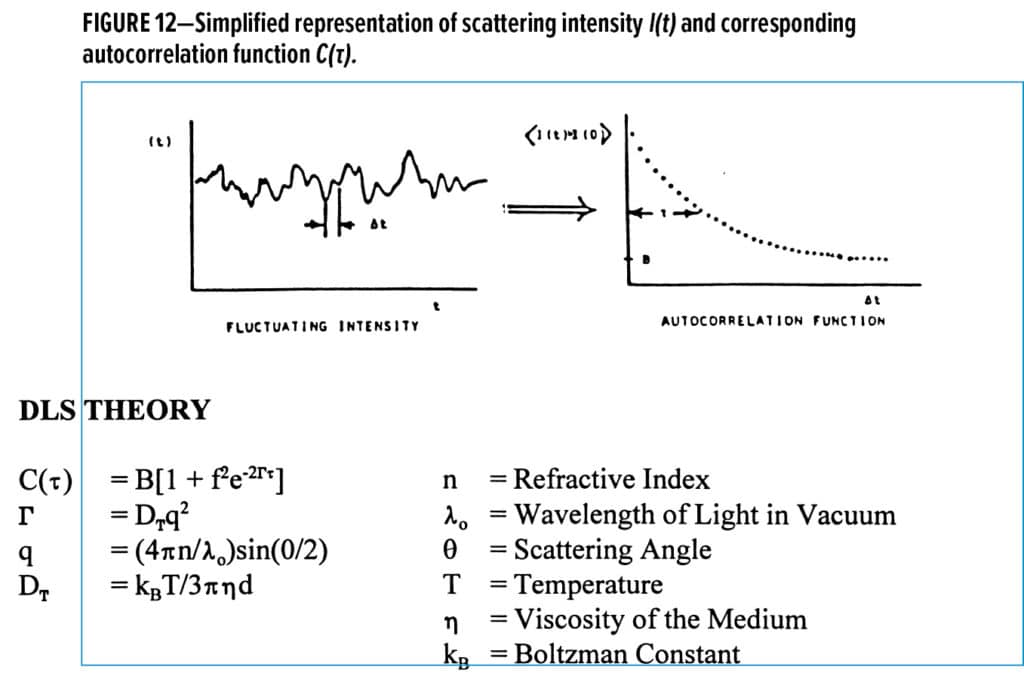
The DLS method utilizes the fluctuations in light scattering intensity observed over a range of time intervals. The autocorrelation function of light scattering intensity at time t is compared to time zero, C(τ) = ( l(t)-I(0)), for a range of Δt intervals. The autocorrelation function can be described by an exponential decay function of Δt. This process is schematically shown in Figure 12. For a monodisperse sphere, the correlation function is represented by an exponential decay function as shown in Figure 12 where DT is the translational diffusion coefficient, q is the scattering wave vector. The particle size d is related to DT through the Stokes-Einstein equation as shown in Figure 12. It has been shown that particle sizes obtained on monodisperse spheres are accurate, precise, and highly reproducible. In addition, the PCS instrument is fast and has high throughput.
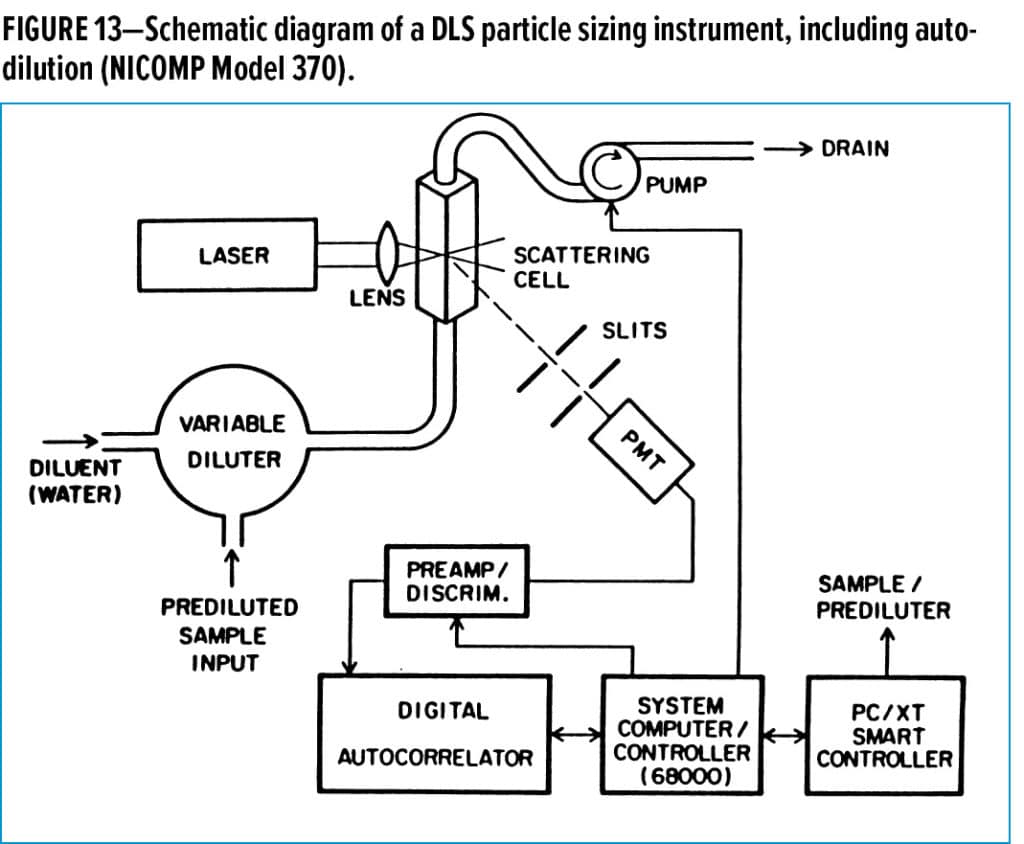
A schematic of a PCS instrument with auto-dilution is shown in Figure 13. This type of instrument also has been shown to have potential for online measurement of particle size for an emulsion polymerization reactor.20
For polydisperse distributions, an average size and estimate of dispersity can be obtained from the method of cumulants. Inversion of correlograms to obtain PSDs for multimodal distributions has had limited success. If particle size modes are in a ratio of 3:1 or greater, then it should be possible to extract the peak modes from the data. This is a low-resolution method compared to techniques such as CHDF, FFF, or sedimentation in a centrifugal force field.
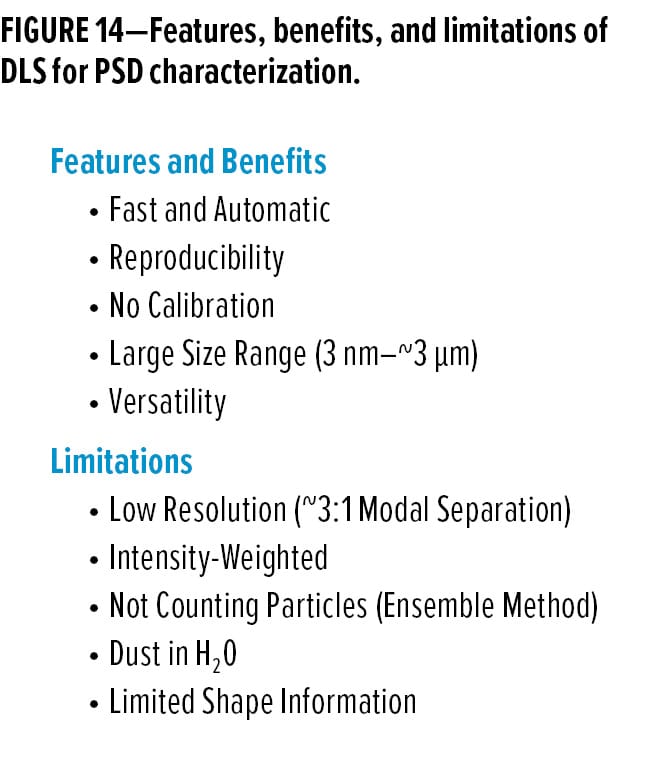
The features, benefits, and limitations of DLS are summarized in Figure 14.
Attempts to Meet Extremely Difficult Technical Challenges
The fourth activity characterizing the changes in PSD characterization and measurement methods involve attempts to meet extremely difficult technological challenges as a result of advances in electronics and computing and sensor technologies. These technological challenges will be discussed below and can be cataloged as follows:
- Measurements in concentrated dispersions
- Wide dynamic particle size range measurement capability in a single instrument
- On-line and at line analyses
- Structural and textural morphology characterization of particle shape
Concentrated Dispersion Measurements
Fiber Optic Quasi-Elastic Light Scattering {FOQELS)
The need to measure particles in concentrated dispersions has led to the development of fiber optics QELS, given the acronym FOQELS by Brookhaven Instruments, for making measurements in concentrated dispersions up to 40% by weight. This commercial development is based on the work of Dhadwal et al.21,22 Visible light from a laser diode is focused into the sample by a monomode fiber, and the scattered light is collected by a second monomode fiber at an angle of 153°. The fluctuations in scattered light are analyzed by the photon correlation technique. As long as the dispersion has observable fluidity, translational diffusion coefficients can be measured and transformed into particle size information. The fiber optics technology enables remote measurement of processes. For small particles less than 100 nm, accurate measurements of size in concentrated dispersion can be obtained. As the particle size increases, deviations from absolute size are observed as the concentration increases due to multiple scattering effects. The precision, reproducibility, and size range of measurement associated with PCS measurements applies to the FOQELS measurements. FOQELS applications reported include particle size growth in emulsion polymerization, nucleation processes in metallic oxide manufacture and monitoring protein crystal growth.23
Laser Light Diffraction
Over the last 30 years, there has been intense activity to revitalize Fraunhofer light diffraction technology to measure concentrated dispersions over a wide dynamic particle size range (0.1–800 mm) by combining Fraunhofer diffraction technology with light scattering detectors to generate a hybrid instrument. There are at least 10 instrument vendors involved in this marketplace. The market pull for this type of instrument has been the need to provide particle size distribution information above and below 1.0 mm with a single instrument. Fraunhofer diffraction physics dates back to 1840. The advent of laser technology coupled with advances in computer technology has made this a viable commercial method of measuring particle size since 1972. The measurement is fast and can be used with dry powders and often the instrument of choice for powder coatings PSD measurements. Combining Fraunhofer diffraction with light scattering detection via Mie theory has enabled measurements to be made down to 0.06 mm, as reported by some vendors. The technique is a moderate to low-resolution technique for extracting multimodal distribution information. Below 2 mm, one has to carefully check the validity of the specific instrument vendor’s software to extract multimodal distributions.
Electroacoustic Efforts
There have been at least three vendors (Matec Applied Sciences, Sympatec, and Malvern Instruments) that have produced instruments which take advantage of electroacoustic techniques in concentrated dispersion to measure both the particle size and the electrophoretic mobility distributions. These techniques are well suited for dense, inorganic materials such as titanium dioxide.24 Exploratory experimentation has been underway to evaluate the technique for organic (low-density) dispersions. The technique is limited with respect to bimodal or multimodal distribution analysis in the same way as is the DLS technique.
Other Methods
Dielectric spectroscopy has some promise for particle size characterization in concentrated colloids, as reported by Sauer et al.25 The authors showed that unique Cole-Cole plots could be obtained as a function of concentration and ionic strength for monodisperse latex particles.
Rheological flow curve analysis using the Cross equation for concentrated dispersions shows correlations of one of the rheological parameters to particle size and distribution.
Both dielectric spectroscopy and rheological flow curve analysis merit further study as possible methods for characterizing the PSD of concentrated dispersions.
Wide Dynamic Particle Size Range Measurement Capability
There has been a lot of activity in developing this capability manifested by the development of hybrid instruments to cover a broad particle size range, some of which has been previously mentioned.
- Fraunhofer Diffraction/Mie Scattering (0.06–8000 µm)
- High resolution gravitational/centrifugal sedimentation
(0.05–100 µm) - Combination of FFF modes (e.g., StFFF with FIFFF or SdFFF)
- Single-particle optical sensing/DLS (0.1–300 µm)
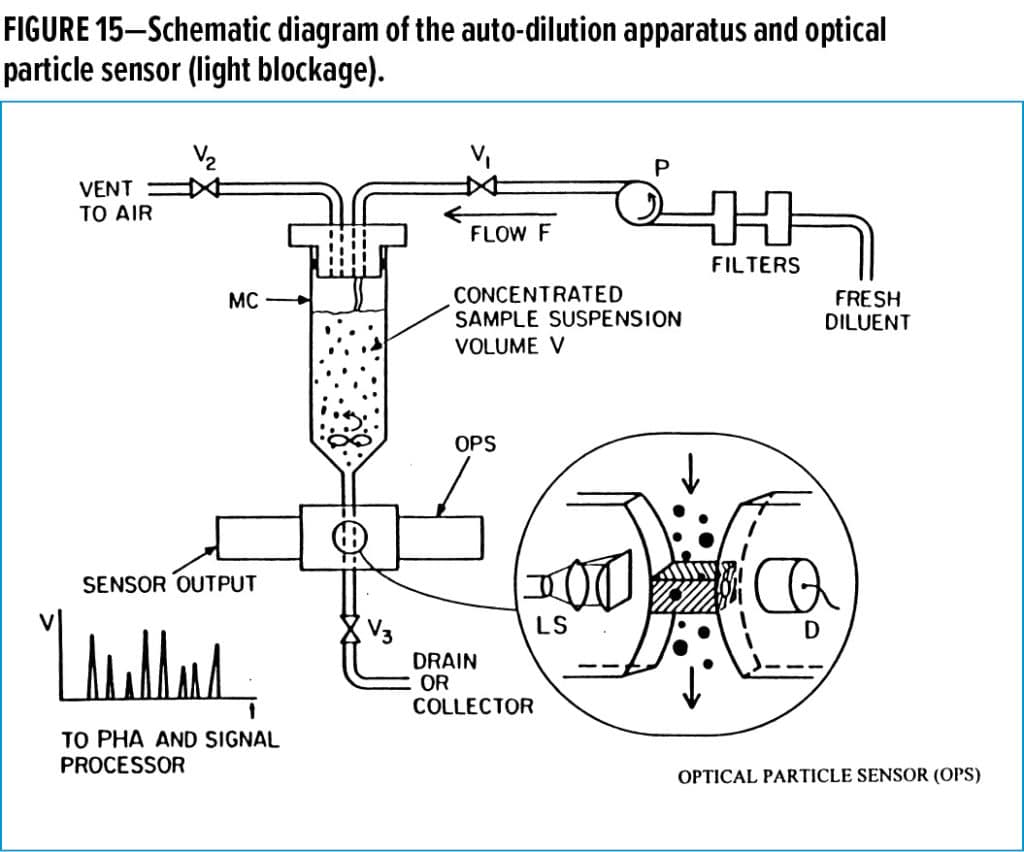
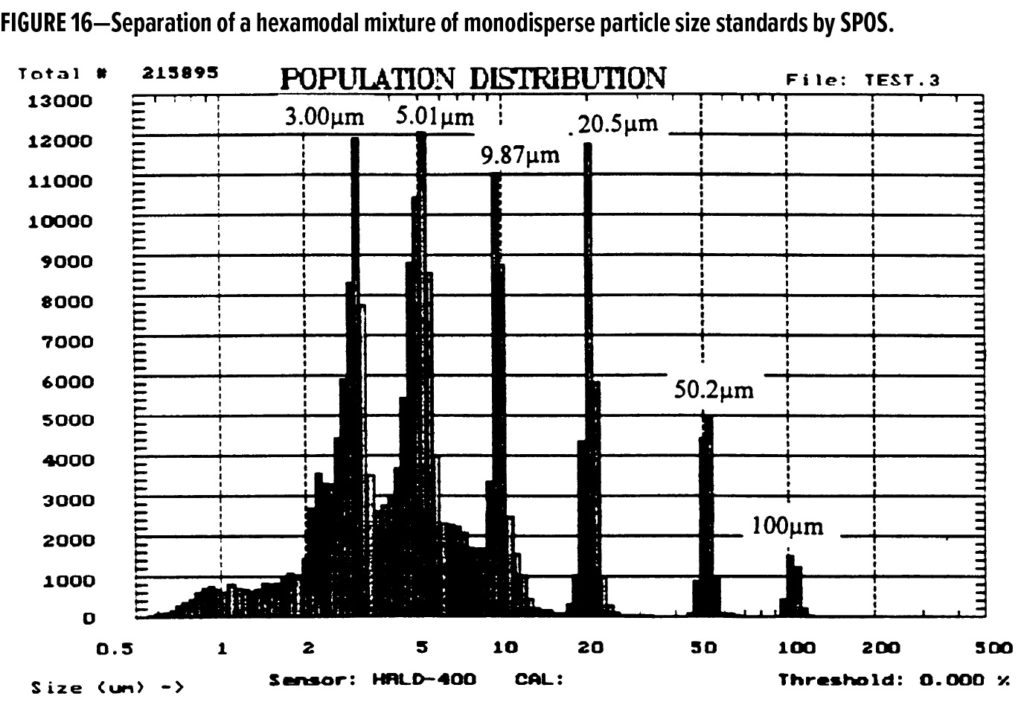
The combination of single-particle optical sensing (SPOS) with DLS offers the possibility of analyzing a broad particle size range conservatively from 0.1–300 µm. The single particle optical sensing method is a photozone sensing method in which particles are counted by their ability to obscure light as they move through an orifice. This technique is automated through an auto-diluter. The sensing size range of SPOS is from about 1–300 µm. The SPOS technique is a high-resolution technique with respect to extracting multimodal distributions and is extremely sensitive to low levels of large particles in the presence of small particles (contaminant analysis). A schematic of the auto-dilution SPOS apparatus is shown in Figure 15 with a separation of a hexamodal mixture of monodisperse particles shown in Figure 16 to demonstrate the resolution of the method. When coupled with DLS, this hybrid instrument can characterize the full PSD of particulate systems in which the main contributor to the PSD are small particles.
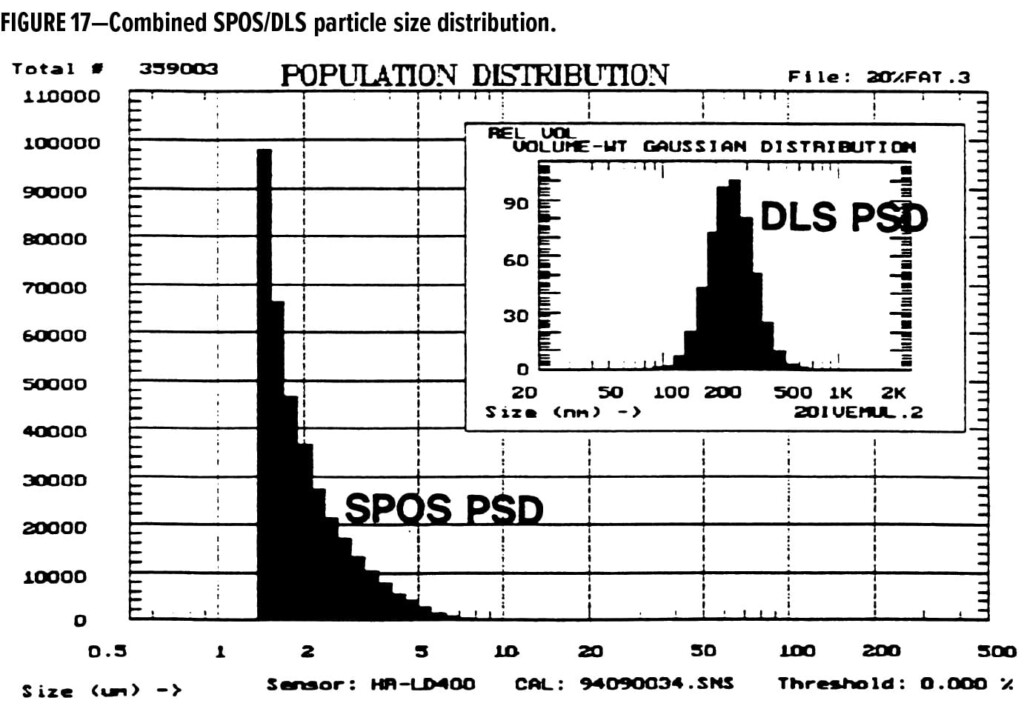
DLS provides characterization of the small particles while SPOS characterizes the small level of larger particles, barely discernible in the DLS size distribution. An example of this type of analysis is shown in Figure 17.
On-Line, At-line Analysis
The main techniques available for on-line and at-line analysis of particle size distributions have been discussed to some degree. These techniques are:
- Fiber optic QELS (FOQELS) for concentrated dispersions
- Automatic dilution PCS
- Automatic dilution turbidity analysis
- Laser sensor-backscatter measurements
Angular scattering and absorbance measurements as a function of wavelength with photo diode array instruments and automatic dilution coupled with sophisticated mathematical analysis of PSDs is revitalizing the classical turbidity measurement and has been the subject of research by Prof. Luis Garcia-Rubio at the University of South Florida at Tampa.26-28
Lasentech has developed a laser backscatter instrument to measure effective particle size (chord length across a particle) in concentrated dispersion from several microns to larger sizes and has found practical application for monitoring particle size changes in many processes.
Structural and Textural Morphology Characterization of Particle Shape
The need for structural and textural morphology information has led to cost/performance improvements in automated image analyzers that now provide shape information using signature wave form characterization and fractal dimension characterization of shape and texture.29
Conclusions
As we look forward toward the future, we can expect further advances in PSD characterization and measurement. It is anticipated that additional hybrid type instruments will be produced to cover a wide dynamic particle size range with improved resolution. The quest for PSD analysis methods for concentrated dispersions with good resolution over a wide dynamic range will continue and will be extremely difficult to achieve. However, advances will continue to be made in providing structural and textural information as a result of advances in computer technology. Another major technical challenge which will probably be met is the development of in-line or in-situ particle size monitoring technology for latex reactors.
In addition, we expect the instruments to be more user-friendly, easier to use, more automated and smarter with respect to programmed intelligence.
Acknowledgement
This article is based partly on an American Chemical Society (ACS) workshop on “Modern Methods of Particle Size Distribution: Assessment and Characterization,” which originated as part of the ACS Division of Polymeric Materials: Science and Engineering technical programming. The author acknowledges the contributions of many of the workshop speakers over the last 30 years for their technical contributions to this evolving workshop and for numerous stimulating discussions on the subject.
Specifically, the author wishes to acknowledge the following individuals: Dr. J. Gabriel Dos Ramos, Dr. David Fairhurst, Mr. Peter Faraday, Dr. J. Calvin Giddings, Mr. Kerry Hasapidas, Mr. Richard Karun, Dr. Brian Kaye, Dr. David Nicoli, Dr. Remi Trottier, Dr. Bruce Weiner, Dr. Kim (Ratanathanawongs) Williams, and Dr. Stewart Wood.
Reprinted from Progress in Organic Coatings, 32 /1-4, Theodore Provder, Challenges in particle size distribution measurement past, present and for the 21st century, Pages 143-153, Copyright (1997), with permission from Elsevier.
References
1. Small, J., Colloid Interface Sci. 1976, 57, 337.
2. Segre, G. and Silberberg, A. J. Fluid Mech. 1962, 14, 136.
3. Regnier, E. and Ball, D., Pittsburgh Conference on Spectroscopy and Analytical Chemistry, 1977, paper No. 447.
4. Dos Ramos, J. G. and Silebi, C. A., J. Colloid Interface Sci., 1989, 133, 302.
5. Silebi, C. A. and Dos Ramos, J. G., J. Colloid Interface Sci., 1989, 130, 14.
6. Thompson, G. H., Meyers, M. N., and Giddings, J. C., Sep. Sci. 1967, 2, 797.
7. Giddings, J. C., J. Chem. Phys., 1968, 49, 81.
8. Kirkland, J. J., Yau, W. W., Doerner, W. A., and Grant, J. W. Anal. Chem., 1980, 52 1944.
9. Giddings, J. C., Ratanathanawongs, S. K., and Moon, M. H., KONA Powder Particle, 9, 1991, 200.
10. Koehler, M E., Zander, R.A., Gill, T. T., Provder, T., and Niemann T. F., ACS Symposium Series No. 332, T. Provder, Ed., 1987, 180.
11. Koehler, M. E., Provder, T., and Zander,R.A. US Patent 4,311,039, 1982.
12. Provder, T. and Holsworth, R. M., ACS Div. of Org. Coatings and Plastics Chemistry Preprints, 1976, 36, 150.
13. M. J. Devon, T. Provder, and A. Rudin, “Measurement of Particle Size Distribution with A Disc Centrifuge: Data Analysis Considerations”, ACS Symposium Series, 472, 134 (1991).
14. M. J. Devon, E. Meyer, T. Provder, A. Rudin, and B. B. Weiner, “Detector Slit Width Error in Measurement of Latex Particle Size Distribution with a Disc Centrifuge”, ACS Symposium Series, 472 154 (1991).
15 Holsworth, R. M., Provder, T., and Stansbrey, J. J., ACS Symposium Series No. 332, T. Provder, Ed., 1987, p. 191.
16. Holsworth, R. M. and Provder, T., US Patent 4,478,073, 1985.
17. Cummins, H. Z., Knable, N., and Yeh, Y., Phys. Rev. Let., 1964, 12, 150.
18. Foord, R., et al., Nature, 1970, 227, 242.
19. Nicoli, D. F. and Elings, V. B., US Patent 4,794,806, Jan. 3, 1989, “Automatic Dilution Systems.”
20. Nicoli, D .F., Korti, T., Gossen, P., Nu, J. S., and MacGregor J. F., “Particle Size Distribution II. Assessment and Characterization”, ACS Symposium Series 472, T. Provder, Ed., 1991, 86.
21. Dhadwal, H., Ansari, R., and Meyer, W., Rev. Sci-lnstrum. 1991, 62 (12), 2963.
22. Dhadwal , H., et al., Proc. SPIE, 1993, 16 ,1884.
23. Application Notes, Brookhaven Instruments, FOQELS.
24. O’Brien R. W., Rowlands, W. N., and Hunter, R. J., Proceedings of the NIST Workshop on “Electroacoustics for Characterization of Particulates in Suspensions”, 1993.
25. Sauer, B. B., Stock, R. S., Lim, K. H. and Ray, W. H.,
J. Applied Polymer. Sci., 1990, 39, 2419.
26. Sacato, P., Lanza, F., Suarez, H., and Garcia-Rubio, L. H. Proceedings of the ACS Division of Polymeric Materials: Science and Engineering, 1996, 75, 30.
27. Bacon, C. and Garcia-Rubio, L. H. Proceedings of the ACS Division of Polymeric Materials: Science and Engineering 1996, 75, 32.
28. A. Brandolin, L. H. Garcia-Rubio, T. Provder, M. E. Koehler and C. Kuo., “Latex Particle Size Distribution from Turbidimetry Using Inversion Techniques: Experimental Validation”, ACS Symposium Series, 472, 20 (1991.
29. Kaye, B., American Laboratory, April 1986, 55.
CoatingsTech | Vol. 17, No. 10 | October 2020