
By Linqian Feng, Andrew Detwiler, Jeffrey Clauson, Abraham Boateng, Hongkun He, Goliath Beniah, Thilanga Liyana Arachchi, and H. Chip Williams, Eastman Chemical Company
Consumer and regulatory pressure to replace bisphenol-A (BPA)-based materials in food contact metal packaging coatings has increased in recent years. Regardless of the controversy around BPA, consumers expect canned foods to be free of substances perceived to have negative health impacts while maintaining current shelf life and flavor characteristics. To address the market needs, formulators must innovate to deliver BPA-non-intent (BPA-NI) solutions that can meet or exceed the performance of BPA-based materials. This presents a challenge with regard to improving the resistance to food sterilization and stability during pack testing, and simultaneously balancing mechanical performance that allows the BPA-NI coating to withstand the aggressive canning process.
One response to these technical challenges has been the development of BPA-NI polyester resin technology through innovation on a monomer basis. This monomer innovation provides protective performance attributes such as resistance to corrosion and chemical attack, while enabling flexibility and adhesion through innovative resin and formulation design. Fundamental techniques such as electrochemical impedance spectroscopy (EIS) and cathodic disbonding were employed in combination with industrial fitness-for-use evaluations to demonstrate the improved protective barrier properties of novel non-BPA resins in formulated coatings. In addition, hydrophobicity and interfacial properties were studied to understand the impact of resin structure on coating performance from both experimental and computational perspectives. Applying this suite of methods and analysis builds strong structure-property correlations as part of a resin development strategy for novel non-BPA resins in metal packaging coating applications.
INTRODUCTION
Bisphenol-A (BPA) is a chemical commonly used in food contact plastics and coatings applications such as the BPA-epoxy-based linings of metal cans containing food or beverages. In recent years, the use of BPA in food contact applications has come under scrutiny. The 2003–2004 National Health and Nutrition Examination Survey (NHANES III) conducted by the Centers for Disease Control and Prevention (CDC) found detectable levels of BPA in 93% of 2517 urine samples from people six years and older.1 In 2008, the National Toxicology Program of National Institute of Health (NIH) determined that BPA may pose risks to human development, raising concerns for early puberty, prostate effects, breast cancer, and behavioral impacts from early-life exposures.2 Due to the potential health concerns, France has banned the use of BPA in all packaging, containers, and utensils intended to come into direct contact with food since 2015.3
With increasing pressure from food brands, formulators and can makers are actively looking for alternative solutions that can meet or exceed the performance of BPA-based coatings. From a technical standpoint, it is challenging to find the right alternatives due to the rigorous performance requirements for the coatings as well as the low price of BPA-epoxy resins. For example, the coating must be able to endure high temperatures, high pressure food sterilization, and long-time direct contact while exposed to the food materials, which include hydrolytic and corrosive environments such as low pH, acids, sulfur, and salt. Adhesion of the coating to the metal can is also crucial for both preventing corrosion and withstanding the can forming process. To respond to the technical challenges, coating scientists and chemists must innovate to develop new resin technologies.
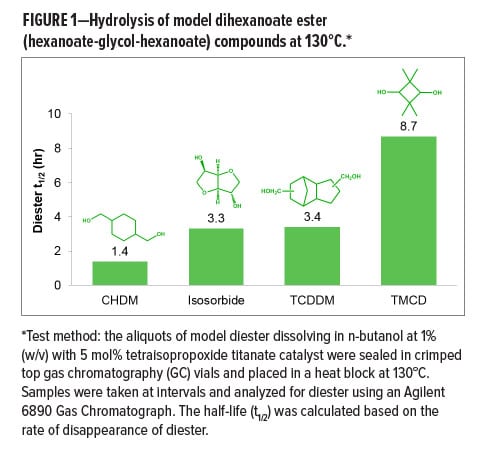
Among all the new resin technologies today, polyesters with a balance of key performance attributes have emerged as one of the most promising alternative solutions. For polyester resins in this application, it should be noted that enabling high glass transition temperature (Tg) in combination with good mechanical properties, such as flexibility and toughness, is critical to the final film performance. These considerations are often applied when selecting monomers for resin design. Therefore, several qualified specialty glycol monomers such as 1, 4–cyclohexanedimethanol (CHDM), isosorbide, tricyclodecane dimethanol (TCDDM), and 2,2,4,4-tetramethyl-1,3-cyclobutanediol (TMCD) have received broad attention as building blocks. TMCD also demonstrated superior hydrolytic stability to other specialty monomers in a degradation kinetics study based on model compounds (Figure 1). Through previous work, polyesters containing TMCD are also known to demonstrate a variety of excellent properties such as good temperature resistance, toughness, chemical resistance, and hydrolytic stability. They have been successfully used in BPA-free specialty plastics applications such as durable water bottles.4-6 Applying the monomer innovation to resin development, TMCD-based resin systems have shown attractive performance attributes such as resistance to corrosion and chemical attack, while enabling flexibility and adhesion through innovative resin and formulation design.
To better understand the structure–property relationships of polyester resins, a series of fundamental methodologies including electrochemical impedance spectroscopies (EIS) and cathodic disbonding tests were developed to study barrier properties, interfaces, and adhesion of metal packaging coatings. EIS is a widely used corrosion evaluation tool based on an electrical analogue of corrosion processes. It uses simple electrical circuits typically comprising of resistive and capacitive elements. For polymer coated metal systems, the EIS test is sensitive to the electrochemical changes at metallic interfaces as well as the resistive properties of organic coatings in a variety of aggressive or corrosive environments. In the past decades, both academia and industry have been using this technique to characterize coating barrier properties including diffusivity and polarity,7 to characterize water uptake,8 to detect formation of blisters and pinholes, and to recognize the loss of adhesion.9 The cathodic disbonding test is also an effective electrochemical technique to evaluate adhesion performance. Cathodic disbonding is an important delamination mechanism associated with interfacial corrosion of organic coatings on metal substrates that lead to an exposure of bare metal to the aqueous food environment.10
In this study, the electrochemical techniques have been employed in combination with industrial fitness-for-use (FFU) evaluations to better understand the barrier properties, interface, and adhesion of metal packaging coatings. This work provides fundamental insights on the relative performance of polyester resins in a variety of formulations where improved barrier properties and enhanced coating-
metal interfacial strength is observed with the TMCD-based resins.
Experimental Procedures
Materials and Sample Preparation
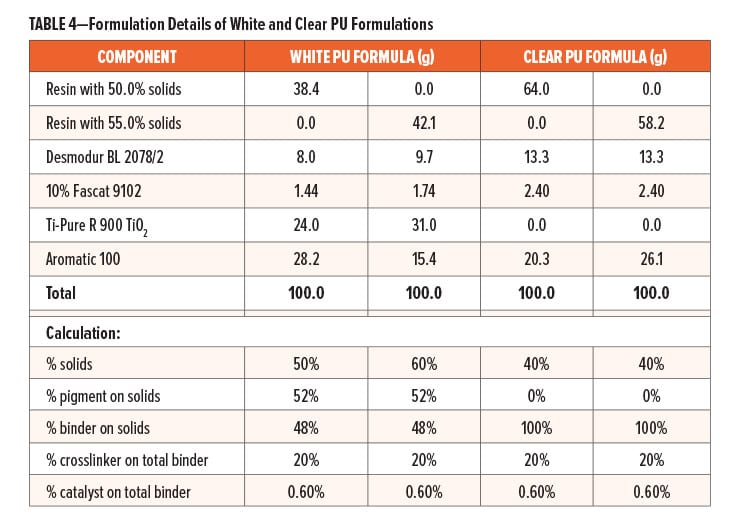
In this study, BPA-NI Resin A and Resin B were TMCD-based polyester resins developed and produced by Eastman Chemical Company, while Control A and Control B are the benchmark resins based on commercial BPA-NI polyesters. All of the polyester resins were classified by molecular weight: both Resin A and Control A (Category A) have absolute-number average molecular (Mn) greater than 10,000 g/mol while Resin B and Control B (Category B) have absolute-Mn in the range of 4,000–7,000 g/mol. Formulation components in this study were chosen for the purpose of representing BPA-NI interior lacquers. All coatings based on these polyester resins were formulated and applied in the Eastman Chemical coating development laboratories. The details of resins and formulation components are given in Table 1 and Table 2.
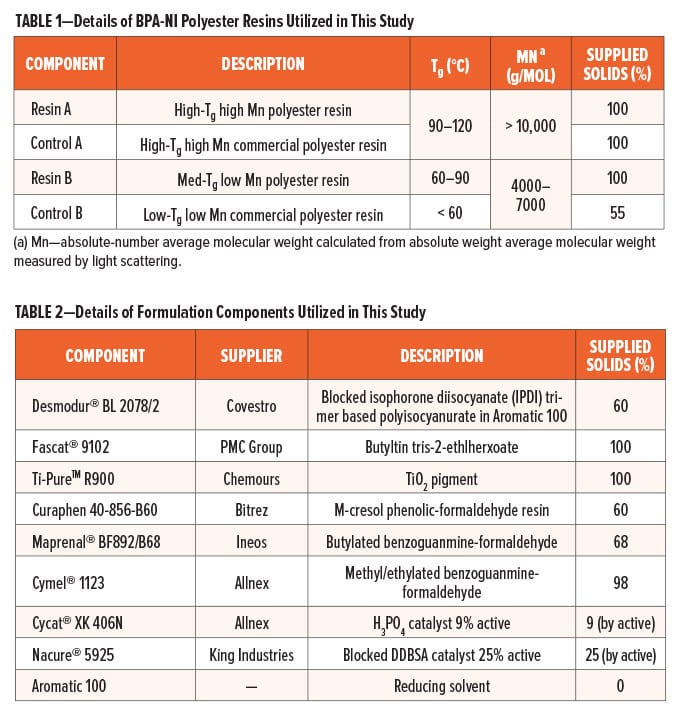
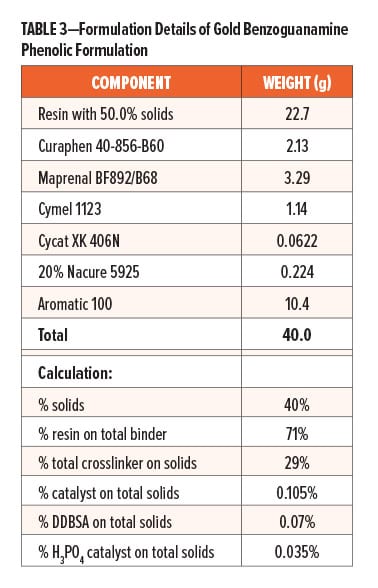
Prior to formulating, Resin A and Control A were reduced with Aromatic 100 to achieve 50% solids; Resin B was reduced with Aromatic 100 to 55% solids; Fascat 9102 catalyst was diluted to 10% of the original supplied concentration with Aromatic 100; likewise, Nacure 5925 catalyst was also diluted to 20% of the original supplied concentration with Aromatic 100. The formulation details of gold benzoguanamine phenolic formulation, clear PU formulation, and white PU formulation are provided in Table 3 and Table 4, respectively.
Electro tin plate (ETP) substrate panels were described by the vendor, Lakeside Metals Inc. as 0.25 # Bright T-1 0.009–0.010 x 4.0 x 12.0 in. All formulated paints were drawn down onto 4.0 x 12.0 in. (10.16 cm x 30.48 cm) tinplates (provided by Lakeside Materials Inc.) using an appropriate wire wound rod targeting a dry film thickness (DFT) of 0.4 mils (10.2 μm) for clear and gold formulations, or 0.6 mils (15.2 μm) for white formulations. Following a 15 min room temperature flash-off at constant temperature and humidity conditions (73°F ± 2, 50% RH ± 5), panels were baked at 200°C for 12 min in an air oven.
Testing and Evaluations
Electrochemical Impedance Spectroscopy (EIS)
A Gamry Instrument “Reference 600” Potentiostat, equipped with Gamry framework and Echem Analyst, was used in electrochemical impedance measurements. The flat coated panels (3.0 x 4.0 in.) were masked by a Gamry designated masking tape with a hollow circle at the center. A cylindrical glass cell with a rubber O-ring attached to the grooved bottom of the cylindrical cell and a clamp fixture was used to hold the samples. A nickel electrode and a graphite electrode were used as reference and auxiliary electrodes, respectively. To simulate food, several food simulants were used as the electrolyte and corrosive environments. The potential was applied in a range of ± 5 mV from open circuit potential and the frequency was varied from 105 to 10-1 Hz.
Cathodic Disbonding Test
The cathodic disbonding test is an internally developed coating disbonding test modified from a number of standard test methods.11 It helps to differentiate coatings on the basis of their susceptibility to adhesion failure in the presence of a defect. The scheme of the cathodic disbonding experimental setup and the lab setup are shown in Figure 2a and 2b. The flat coated panels (3.0 x 4.0 in.) were masked by a Gamry designated masking tape with a hollow circle at the center. In the unmasked area at the center, the coatings were scribed with an “X” mark (as shown in Figure 2b using a knife. A cylindrical glass cell with a rubber O-ring attached to the grooved bottom of it and a clamp fixture was used to hold the samples. A coated panel with X scribe (cathode) was connected with the negative electrode of the voltage supply while a graphite (anode) was connected with the positive electrode of a direct current (DC) voltage supplier. Between cathode and anode, the cylindrical glass cell was filled with electrolyte made by 3.5 wt% NaCl solution with 150 ppm Manoxol OT solution to ensure both parallel electrodes were submerged in the electrolyte solution. The DC voltage applied between the parallel cathode and anode was 5 volts (V) for 60 sec. After this electrochemical process was completed, the sample was rinsed with DI water and followed by air drying.
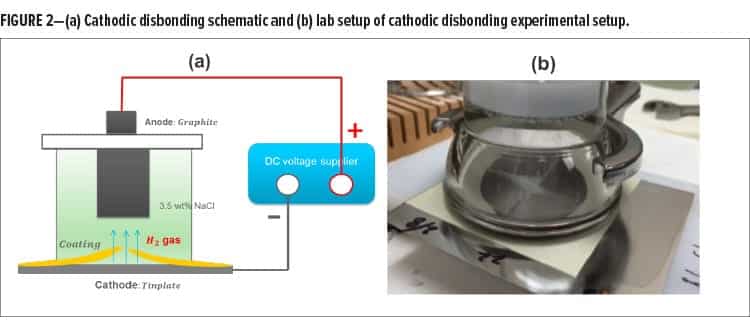
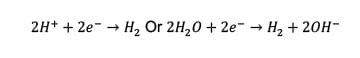
Under the applied DC electric field, the hydrogen bubbles were initially generated at the X scribe and then propagated to the coating-tinplate interface following the cathode reaction as shown in equation (1). In addition to the hydrogen bubbles generated at the metal surface lifting up the coating from the tinplate, the generation of OH¯ also weakens the coating–tinplate adhesion, resulting in coating delamination.
(1) 
Food Simulants and Retort
The recipes of food simulants used in this study are shown below:
(i) Lactic acid–Acetic acid-Salt (LAS) food simulant: 1 wt% lactic acid, 1 wt% acetic acid, and 1 wt% NaCl in 97 wt% DI water;
(ii) 3% Acetic acid food simulant: 3% acetic acid in 97% DI water; and
(iii) 2% Lactic acid food simulant: 2% lactic acid in 98% DI water.
A coupon measuring 2.5 x 4.0 in. was cut from the coated panel for retort testing. The coupons were scribed by a knife with an X mark on the bottom-half of the panel and then placed in 250 mL closed-cap glass jars half filled with 3% acetic acid food simulant where half the coupon is out of the food simulant and the other half is submerged in food simulant. The retort test was conducted on a coated panel with an X scribe at 131°C for 60 min in an autoclave.
Computational Modeling
Calculated LogP values which estimate the value of the octanol-water partitioning coefficient were determined by using ACD/Labs Chemsketch software. The calculated logP values were also validated by ChemBioDraw Ultra 13.0, Molinspiration and Accelrys Materials Studio 5.5. Molecular structures of trimer model compounds represented as glycol1-terephthalate-glycol2 (G1-T-G2) with hydroxyl end groups were used in the experiments and calculations.12
Solubility parameters were calculated for 30x30x30 Å3 amorphous cells with 1 g/cm3 cell density for 3 terephthalate and glycol units that were constructed by using Accelrys Materials Studio 5.5 software. PCFF forcefield was used to build and minimize cells and calculate cohesive energies, which led to the calculation of cohesive energy densities followed by calculation of solubility parameters.13 Average solubility parameters were calculated for 500 different amorphous cells followed by 5000 steps of molecular mechanics geometry optimization with Ewald Summation method14 and 12.5 Å vdW cut-off distance for each composition.
Results and Discussion
EIS and Corrosion Mechanisms
EIS is a powerful technique to understand corrosion mechanisms and barrier properties of coatings by providing an accurate in-situ measurement for characterizing polymer-coated metals and changes in coating performance during exposure in corrosive environments. The term “impedance” refers to the frequency-dependent resistance to current flow of circuit elements such as resistors, capacitors, inductors, etc. In practice, the corrosion resistance is integrated from all types of resistance involved and can be approximately estimated by using |Z(w®0)|, the impedance value at low frequencies. In this study, corrosion resistance is identified by the impedance value at 0.1 Hz. However, to describe the corrosion process quantitatively, Bode plots are fitted using electrical equivalent circuits corresponding to the appropriate stage of corrosion.
Stage Zero: Dry Film
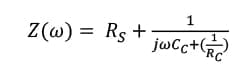
Like a dielectric layer, before immersion in an electrolyte solution a dry polymer film often plays a role like a pure capacitor as shown in Figure 3. When the film responds to the frequency, the overall impedance can be presented as shown in equation (2):
(2) 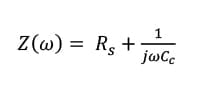 therein ω = 2πf
where j is the complex number ( j 2=-1); Rsis the solution resistance which is the resistance of the food simulant; Ccis the coating capacitance; w is the angular frequency; and f is the frequency. The Bode plot for Stage zero is simply demonstrated in Figure 3.
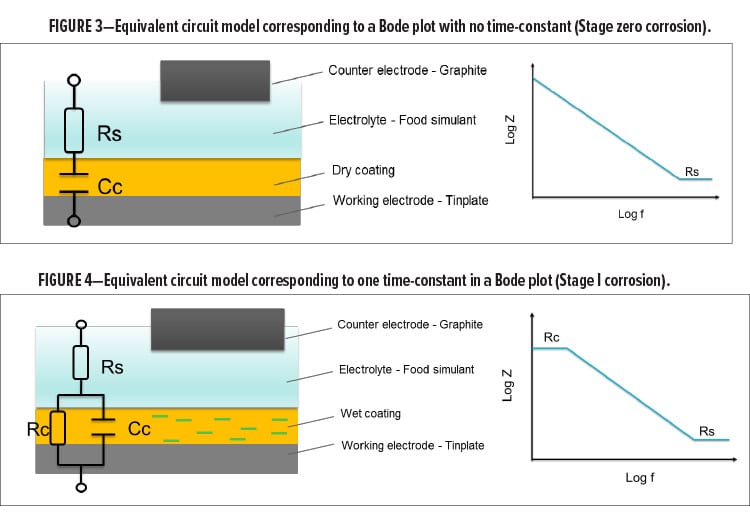
Stage I: Food Simulant Absorption
Before the corrosion process starts, the dry coating must absorb the electrolyte until the polymer film gets fully saturated by the electrolyte as shown in Figure 4. The electrolyte is the food simulant in this case. In Stage I, the coating is no longer a pure capacitance due to the presence of water and ions. Instead, the combination of the capacitance component and the resistance component of the coating contribute to the overall impedance. With higher water and ion uptake, the value of the capacitance component increases while the value of the resistance component decreases. They change independently as a function of time before the film gets fully saturated by the food simulant. In general, the diffusion kinetics are highly dependent on the physical properties of the polymer film such as crosslinking density. When the film responds to the frequency, the overall impedance can be presented as shown in equation (3):
(3)  where j is the complex number ( j 2=-1); Rsis the solution resistance which is the resistance of the food simulant; Cc is the coating capacitance; w is the frequency; and Rc is the coating resistance. As shown in Figure 4, a single time-constant can be indicated by a frequency–independent impedance plateau at low frequency followed by a frequency–dependent impedance plot in the medium frequency region. The increase of Ccas a function of exposure can be used to determine the diffusion coefficient as well as the food simulant uptake.
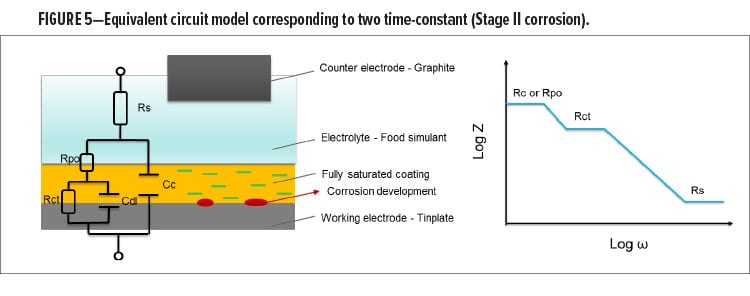
Stage II: Corrosion Initiation
After the film gets fully saturated, water and ions in the food simulant start to be delivered to the coating-tinplate interface and initiate the corrosion process. In this process, the redox reactions between the metal and food simulant (H+ either from food simulant or from hydrolyzed water) lead to corrosion. At this stage, the newly formed oxidized layer with semi-dielectric character exists under the polymer film, playing a role as the combination of a double layer capacitance and a charge transfer resistance, as presented in equation (4):
(4) 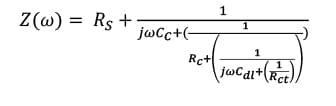
where Rs is the solution resistance which is the resistance of the food simulant; Cc is the coating capacitance; w is the angular frequency; Cdl is the double layer capacitance; Rct is the charge transfer resistance; and Rc is the coating resistance.
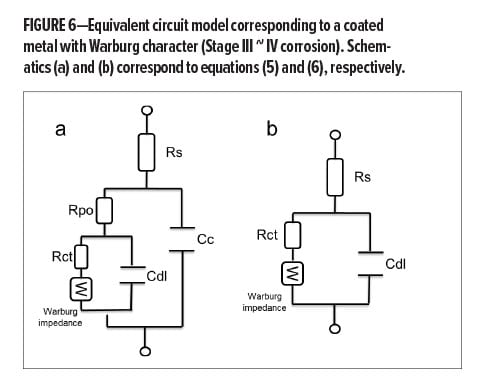
Stage III ~ IV: Pore/breakthrough Formation and Delamination
A process that depends on diffusion of reactants toward or away from the surface has a particular low-frequency character. The impedance with this characteristic is usually described as “Warburg” impedance (as shown in Figure 7), which indicates the breakthrough of a barrier and localized disbonding. At this stage, the overall impedance can be presented as shown in equation (4) (pore/breakthrough formation) and equation (5), (delamination), respectively:
(5) 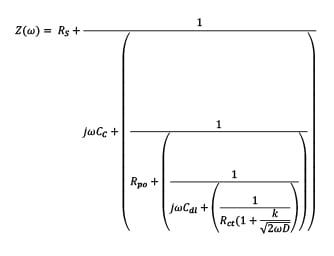
(6) 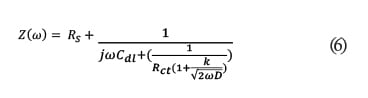 where Rs is the solution resistance which is the resistance of the food simulant; Cc is the coating capacitance; w is the frequency; Cdl is the double layer capacitance; Rct is the charge transfer resistance; Rpo is the pore resistance; k is the redox reaction rate; and D is the diffusion coefficient at this stage. At Stage III ~ IV, the barrier has been damaged locally, even though the defects might not be able to be detected by the naked eye. In this case, Rct representing pore resistance is used to describe the concept of “coating resistance” because this value now is highly dependent on the number of pores in the film or capillary channels resulting from the formation of ionically conducting paths through the coating, instead of the intrinsic physical properties of the coating barrier.
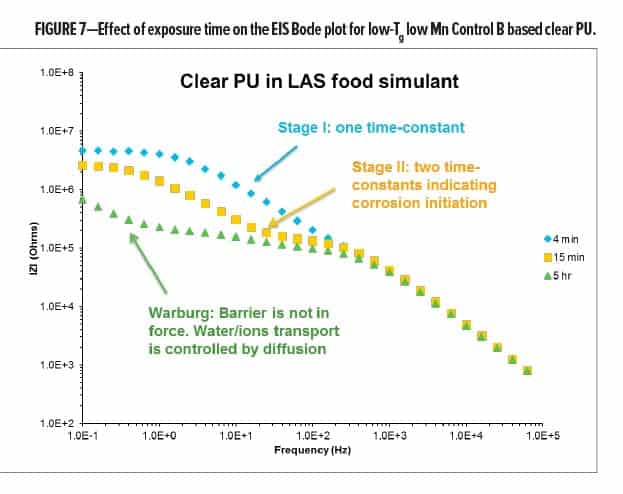
To demonstrate the progression of coating failure as a function of LAS food simulant exposure time, Control B was chosen to formulate a clear coating, then subjected to the EIS test in LAS food simulant. As shown in Figure 7, Control B in a clear PU formulation starts to show Stage I corrosion (one time-constant) after 4 min of exposure, indicating that the food simulant absorption has begun. After 15 min, the characteristics of Stage II corrosion (e.g., two time-constants) have been observed, and this is followed by the Bode plot with Warburg character (Stage III ~ IV) after 5 h of exposure in LAS food simulant.
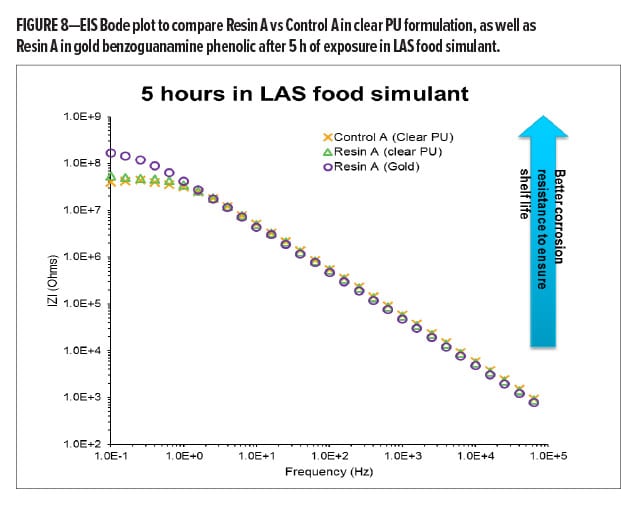
To compare BPA-NI polyester resins in clear PU formulations, Resin A and commercial Control A were selected to formulate the paints followed by appropriate baking. A comparison of the EIS spectrum of Resin A and Control A in these two coatings in Figure 8a shows similar corrosion resistance and barrier properties after 5 h of exposure. Resin A-based clear PU shows a corrosion resistance of 53.7 mega Ohms, which is slightly higher than that of the Control A-based coating (39.8 mega Ohms). Both coatings demonstrate excellent barrier properties and almost two orders of magnitude improvement on corrosion resistance after 5 h of exposure as compared to the low Tg polyester control in the same formulation (0.69 mega Ohms, as shown in Figure 7).
In Figure 8, Resin A was formulated in both clear PU and gold benzoguanamine phenolic formulations. Through the comparison of EIS data after 5 h of exposure (Stage I corrosion), it has been found that the gold benzoguanamine phenolic formulation exhibits significantly better corrosion resistance (170 mega Ohms) as compared to the corrosion resistance of clear PU formulation (53.7 mega Ohms) at the same dry film thickness. The authors believe that the presence of triazine and aromatic structures in benzoguanamine-formaldehyde and phenolic-formaldehyde crosslinkers may provide better hydrophobicity and barrier properties as compared to IPDI trimer-based PU structures.
Time-based Corrosion Resistance
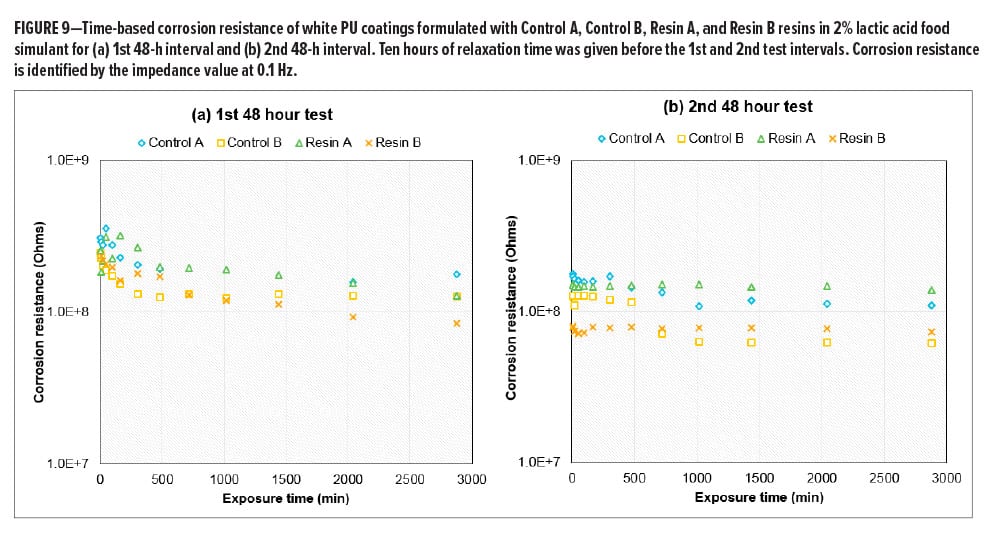
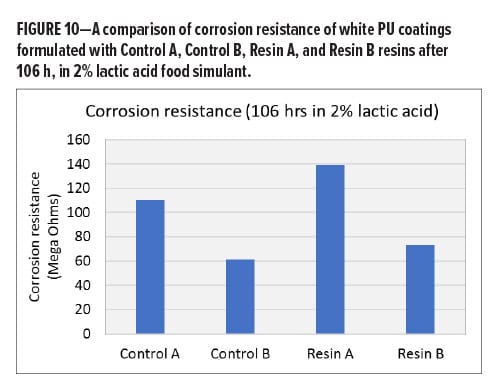
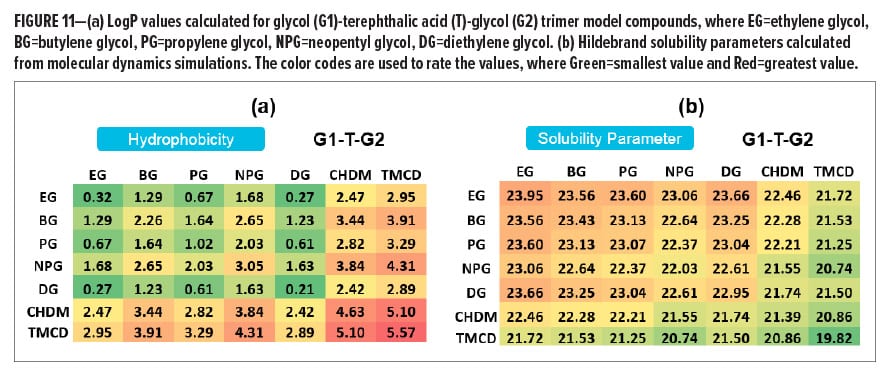
In many cases, corrosion is an electrochemical process that requires multiple steps, and each step is associated with a different mechanism and kinetics. The estimation or prediction of long-term corrosion performance, such as the corrosion observed in a pack test, often relies on continuous time-based corrosion observations over a relatively long interval of testing instead of a single data point at a short exposure time. As part of a resin design strategy, a continuous in-situ EIS test has been conducted on white PU coatings based on four BPA-NI polyester resins including Control A (high-Tg high Mn polyester), Control B (low-Tg low Mn polyester), Resin A (high-Tg high Mn polymer), and Resin B (med-Tg low Mn polyester) in 2% lactic acid food simulant. The EIS test in one testing period was set up to continuously run for 48 h. Ten hours of relaxation time was given prior to the next testing period. Figure 9a and 9b demonstrate a decay of corrosion resistance as a function of exposure time for each sample during the 1st and 2nd 48-h test intervals. After a total of 106 h of exposure, all the white PU samples still remain in the Stage I corrosion process. During the 2nd 48-h test period, the decay of corrosion resistance for each sample becomes significantly slower, followed by a plateau of impedance at longer times. The two high Mn polyesters seem to be separated from the other two low Mn polyesters after the 2nd 48-h interval, where the high Mn polyester-based coatings show higher values of corrosion resistance. By the end of the test, the comparison of all four white PU coatings shows a ranking on corrosion resistance: Resin A > Control A > Resin B > Control B in white PU formulations (Figure 10). Since all of the samples are still in Stage I corrosion, the decay kinetics indicate the diffusion coefficient while the films absorb the food simulant, whereas the plateau level reflects the solubility of the electrolyte solution in the coating film. Therefore, higher corrosion resistance correlates with higher hydrophobicity or lower solubility in 2% lactic acid food simulant in this case. In Figure 11, LogP and Hildebrand solubility parameters were calculated for glycol (G1)-terephthalic acid (T)-glycol (G2) trimer model compounds through computational modeling. In general, a higher LogP value or lower Hildebrand solubility parameter indicates better hydrophobicity of a polymer. With the same molecular weight (trimers) and acid composition (terephthalic acid) in the model compounds, it has been hypothesized that the glycols with higher LogP values or lower Hildebrand solubility parameter lead to a lower concentration of the aqueous food simulant in the bulk of the film, thus reducing the rate of corrosion.12 Considering the molecular weight contributions in the resins, the comparison between a TMCD-based resin and a control polyester resin at a similar molecular weight and Tg range (Resin A vs Control A and Resin B vs Control B) indicates that the improvement of corrosion resistance in coatings formulated with Resin A and Resin B is primarily due to the hydrophobicity contributions from TMCD (Figure 11).
Interface and Adhesion
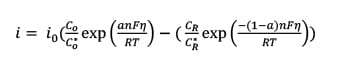
To better understand what happened during late stage corrosion, the EIS comparison between Resin A- and Control A-based clear PU coatings (shown in Figure 8a) was extended to longer exposure times. After 12 days in LAS food simulant, it has been observed that both Resin A- and Control A-based clear PU coatings are in Stage III ~ IV corrosion with clear Warburg impedance in the Bode plots (Figure 12). Although the pores and capillary channels that provide conducting paths (e.g., Warburg impedance) through a coating have already formed in both Control A- and Resin A-based clear PU coatings, the interface, with its excellent double-layer capacitance and charge transfer resistance, can still provide excellent corrosion prevention.
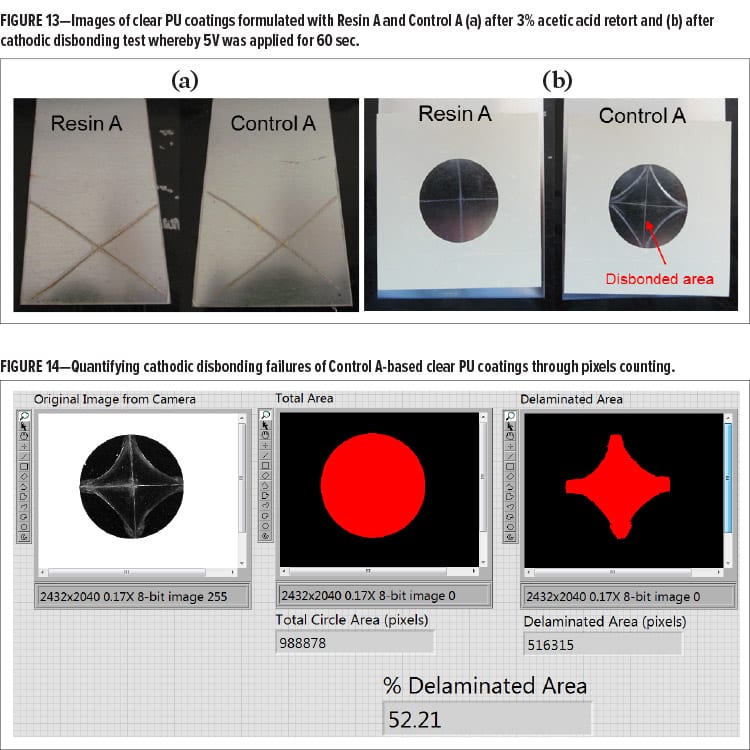
In Figure 12, Resin A shows a higher plateau in the middle—frequency range, which indicates the value of charge transfer resistance corresponding to equation (6). When a redox reaction occurs, electrons enter the metal and metal ions diffuse into the electrolyte. Thus, charge is being transferred. The current density of the charge transfer process at the applied potential follows Faradays Law [equation (7)]:
(7)  where io is exchange current density; Co is the concentration of oxidant at the electrode surface; Co* is the concentration of oxidant in the bulk; CR is the concentration of reductant at the electrode surface; CR* is the concentration of reductant in the bulk; h is the overpotential (difference between applied potential and open circuits potential, OCP); F is Faradays constant; T is absolute temperature; R is the ideal gas constant; a is the reaction order; and n is the number of electrons involved. When the overpotential is very small (± 5 mV vs OCP in this experiment) and the electrochemical system is at equilibrium (Co = Co* and CR = CR* ), charge transfer resistance can be represented, as shown in equation (8):
(8)  With the same experimental conditions, the difference between the two clear PU coatings on charge transfer resistance is believed to be due to the number of electrons involved, which correlates to the percentage of area without polymeric barrier due to the loss of adhesion. Several studies15-17 for different applications have found that charge transfer resistance is correlated to adhesion experimentally. For the comparison shown in Figure 12, the authors believe that the Resin A-based clear PU with significantly higher charge transfer resistance indicates that Resin A provides a clear PU coating with a stronger coating-tinplate interface and better adhesion as compared to Control A.
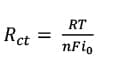
Besides the EIS tests, gloss loss after a 3% acetic acid retort test was measured as a way to evaluate the barrier performance of the coatings. As the retort test was conducted on a coated panel at 131°C for 60 min in an autoclave, the presence of high temperature and pressure has significantly accelerated the corrosion formation at the coating-tinplate interface, causing the development of “blisters” as the result of under-film corrosion. This process often leads to gloss loss due to (i) the changes in surface and interface smoothness caused by under-film corrosion; (ii) rust stains the coating surface caused by broken “blisters”; and (iii) a change in coating refractive index caused by water retention. Similar to what occurs during the late stage corrosion process, the corrosion development and coating delamination at X scribes could be much faster than that in other areas because the barrier layer has been broken through manually. In this scenario, adhesion performance can be evaluated based on a visual observation. As shown in Figure 13a, no significant difference can be observed between Resin A- and Control A-based clear PU coatings from gloss reduction, indicating that Resin A provides similar barrier properties as Control A in the clear PU formulation. This retort result is consistent with the insights obtained from EIS data (Figure 8a).
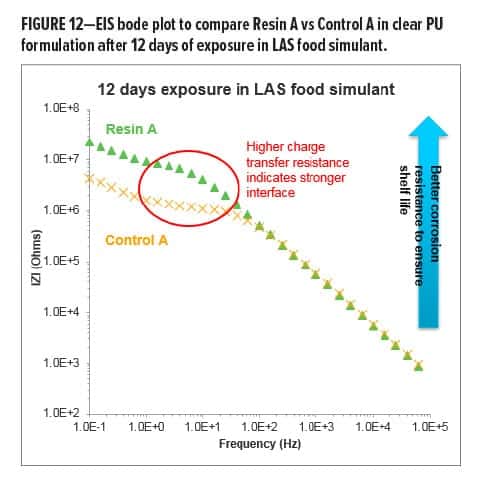
In Figure 13b, when the aggressive cathodic disbonding test was applied under 5V on X scribed panels, the Control A-based clear PU coating with a large disbonded area (less desirable) is differentiated from the Resin A-based coating with very little disbonded area (more desirable). The disbonded area was identified by a high-resolution camera and the areas of bare tinplate were quantified by pixel-counting image analysis software (Figure 14). In this case, the disbonded area, in percentage of the total area, of Control A-based clear PU coating was determined as approximately 52%, while only a minor disbonded area (< 5% disbonded area) was found for Resin A-based clear PU coating. In this case, a smaller disbonded area indicates better adhesion or interfacial strength. The cathodic disbonding result in Figure 13b is consistent with the EIS results (Figure 12) regarding adhesion performance. The combination of EIS and cathodic disbonding results indicates that Resin A provides a stronger interface to tinplate as compared to Control A. Considering the molecular weight and Tg effects, the comparison between TMCD-based Resin A and Control A polyester resin at a similar molecular weight and Tg range indicates that the improvement of adhesion in coatings containing Resin A could be due to the hydrophobicity contributions from TMCD.
CONCLUSIONS
In this study, fundamental methodologies based on EIS and cathodic disbonding tests were successfully developed and applied to understand the barrier properties, interfaces, and adhesion of BPA-NI metal packaging coatings. Corresponding to EIS Bode plot characteristics, a series of equivalent circuit models indicating the stages of corrosion process were developed to demonstrate the degradation mechanisms including (i) food simulant absorption, (ii) corrosion initiation, and (iii) pore/breakthrough formation. These circuit models also enable quantitative analysis of coating performance to design resins that are in tune with coating properties in metal packaging applications.
A combination of electrochemical techniques and industrially relevant FFU evaluations were conducted to differentiate the corrosion resistance of TMCD containing vs non-TMCD containing clear and white PU coatings. In the early stage corrosion process, Resin A exhibited a slightly improved barrier performance in the coatings as compared to Control A due to the low permeability after being fully saturated by the food simulants. This is believed to be due to the hydrophobicity contribution from TMCD in polyester Resin A. A similar conclusion has been obtained when comparing the TMCD-containing Resin B to the Control B resin in both white and clear PU coatings.
In addition to PU formulations, TMCD containing Resin A and Control A resin were also formulated with benzoguanamines and phenolic crosslinkers to evaluate these resins in gold lacquer applications. A comparable barrier performance was observed during the early stage corrosion processes in a clear PU coating with Resin A in and Control A. However, the comparison between Resin A in the clear PU formulation and gold benzoguanamine phenolic formulations indicates that the gold formulation is significantly better on barrier performance with the same resin and film thickness.
EIS results for a late-stage corrosion process based on Resin A- and Control A-based clear PU coatings are consistent with the results obtained from cathodic disbonding tests. Analysis of these results demonstrates that the coating made with TMCD-containing Resin A provides a significantly improved coating-tinplate interface that leads to superior adhesion performance as compared to Control A resin in a clear PU formulation.
ACKNOWLEDGMENT
Technical expertise provided by Damiano Beccaria, Sandra Case, Peter Chapman, Alain Cagnard, Samuel Puaud, John Maddox and Carlos Carvajal from Eastman Chemical Company is gratefully acknowledged. The Computational Modeling results presented in this paper were generated in collaboration with Erol Yildirim, Harold Freeman, and Melissa Pasquinelli, Fiber and Polymer Science Program, North Carolina State University. The contribution made by Dr. Yildirim for this paper is highly appreciated. The authors also appreciate the technical support from Dr. Li-piin Sung through the Polymer Surface Interface Consortium, Engineering Laboratory, National Institute of Standards and Technology.
References
1. https://www.niehs.nih.gov/health/topics/agents/sya-bpa/index.cfm.
2. https://www.ewg.org/research/timeline-bpa-invention-phase-out#.W7YW9FRKi9I.
3. https://www.foodpackagingforum.org/news/france-bans-bpa.
4 Kelsey, D.R., Scardino B.M., Grebowicz, J.S., and Chuah, H.H., “High Impact, Amorphous Terephthalate Copolyesters of Rigid 2,2,4,4-Tetramethyl-1,3-cyclobutanediol with Flexible Diols, Macromolecules, 33, 5810-5818 (2000).
5. Zhang, M., Moore, R.B., and Long, T.E., “Melt transesterification and characterization of segmented block copolyesters containing 2,2,4,4-tetramethyl-1,3-cyclobutanediol,” J. Polym. Sci. Part A: Polym. Chem., 50, 3710-3718 (2012).
6. Clark, R.D., Treatment of 2, 2, 4, 4-tetraalkyl-1, 3-cyclobutanediols, US3236899A, in: Eastman Kodak Co., 1966.
7. Feng, L. and Iroh, J.O., “Corrosion resistance and lifetime of polyimide-b-polyurea novel copolymer coatings,” Prog. Org. Coat., 77, 590-599 (2014).
8. Kefallinou, Z., Lyon, S.B., and Gibbon, S.R., “A bulk and localised electrochemical assessment of epoxy-phenolic coating degradation,” Prog. Org. Coat., 102, 88-98 (2017).
9. Mansfeld, F., “Use of electrochemical impedance spectroscopy for the study of corrosion protection by polymer coatings,” J. Appl. Electrochem., 25, 187-202 (1995).
- Bi, H. and Sykes, J., “Cathodic disbonding of an unpigmented epoxy coating on mild steel under semi- and full-immersion conditions,” Corros. Sci., 53, 3416-3425 (2011).
- Holub, J., Wong, D.T., and Tan, M., “Analysis of CDT methods and factors affecting cathodic disbondment,” from NACE International Corrosion Conference and Expo, Nashville, TN, pp. 5199, 2007.
- Yildirim, E., Freeman, H., Pasquinelli, M., and El-Shafei, A., “Role of chemical structure on the alkaline hydrolysis of industrially-relevant copolyester model compounds,” from 252th ACS National Meetings, Philadelphia, PA, 2016.
- Dechant, J., Polymer Handbook, 3rd Edition. Brandrup, J. and Immergut, E.H. (Eds.), ISBN 0-471-81244-7. New York/Chichester/Brisbane/Toronto/Singapore: John Wiley & Sons, 1989. ca. 1850 pages; Acta Polymerica, 41, 361-362 (1990).
- Tosi, M.P., “Cohesion of Ionic Solids in the Born Model,” Based on work performed under the auspices of the U.S. Atomic Energy Commission, in: Solid State Physics, Seitz, F. and Turnbull, D. (Eds.), Academic Press, pp. 1-120, 1964.
- Wang, M. and Sakamoto, J., “Correlating the interface resistance and surface adhesion of the Li metal-solid electrolyte interface,” J. Power Sources, 377, 7-11 (2018).
- Lu, F., Song, B., He, P., Wang, Z., and Wang, J., “Electrochemical impedance spectroscopy (EIS) study on the degradation of acrylic polyurethane coatings,” RSC Advances, 7, 13742-13748 (2017).
- Qian, Y., “Electrochemical Impedance Spectroscopy Investigation of a Polyimide Coating on Q345 Steel,” Int. J. Electrochem. Sci., 12, 3063–3071, 2017.
*This paper received the Best Paper Award at the 2019 CoatingsTech Conference, sponsored by the American Coatings Association, April 8–10, in Cleveland, OH.
CoatingsTech | Vol. 16, No. 6 | June 2019