

By George R. Pilcher, The ChemQuest Group, Inc.
Insight into the state of the U.S. coatings industry is valuable for many—whether you are directly employed by paint and coatings companies or suppliers of specialty chemicals used within the industry; serve as an industry observer interested in correlating the health of the industry with similar enterprises in the specialty chemicals market space; work for an independent formulating and/or testing laboratory that does business with the coatings industry; or work on Wall Street charged with analysis of the paints and coatings sector. Regardless of the reason(s) for your interest in the coatings industry—and regardless of what you are planning to do with this information—it is statistically unlikely that you will read this article about the current state of the paint and coatings industry in 2019, and then lose no time hiring technical and marketing people to help you create a strategy for getting through the coming (and inevitable) recession, whenever it occurs, and then going on to glory following the end of the recession.
Here is a newsflash for anyone who has a sufficiently strategic point of view to follow this line of thinking: Play your cards right by making sure that you are either maintaining (or increasing) your technical and marketing departments during downturns in the economic cycle, and developing the products that your customers are going to need following the next recession, and you will be living the high life when the economy begins to recover. If you don’t maintain your technical and marketing staff during downturns under the mistaken impression that they are expendable, you do so at your own peril.
It is difficult to think in terms of strategic planning in an industry that has become not only focused on this year, but on this quarter and—all too often—on this month. It has been made even easier to ignore strategy because, during the 122 months since the ending of the Great Recession, the United States has experienced not only the longest post-war recovery from recession, but also the longest post-recession recovery in modern world history.
With regard to the state of the U.S. paint and coatings industry, it is always important to take a look at the macro-economic picture that surrounds all businesses that depend upon the specialty chemical stream for their livelihood. For the 12-month period ending in April 2019, GDP grew from 2.2% to 3.1%, which is not bad, but not what many in the country had hoped for, especially since the United States is basically at full employment. The outlook for GDP during the remainder of 2019 is only expected to be ~2.0%, then falling to 1.9% during Q1 of 2020, and continuing to fall during Q2 to roughly 1.7%. It is within the context of the current overall economic situation that we now turn to the U.S. coatings industry performance during 2019 so far, and its anticipated performance during the remainder of the year and into 2020.
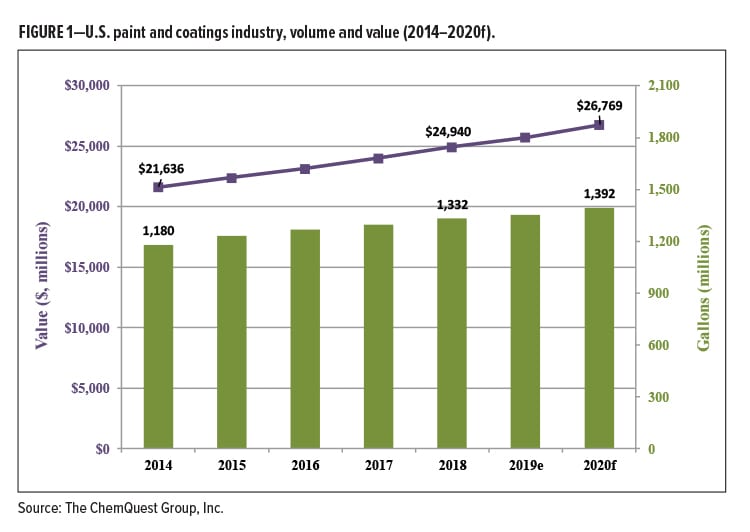
2019 will not be a bad year for paint and coatings in the United States, but it won’t be anything to write home about, either—2018 ended with production of 1.33 billion gallons valued at $24.9 billion, up 2.7% in volume and 3.8% in value, and the outlook for 2019 suggests full-year production of 1.35 billion gallons valued at $25.7 billion, up 1.6% in volume and 3.2% in value (Figures 1–3).
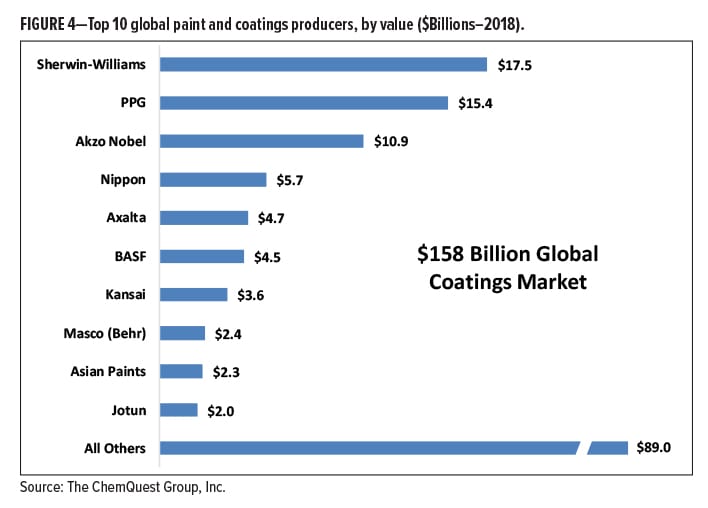
As a result of aggressive consolidation, the top three global coatings firms account for 63.5% of the top 10 global coatings firms’ sales, up from 48% in 2005 (Figure 4).
ARCHITECTURAL PAINTS
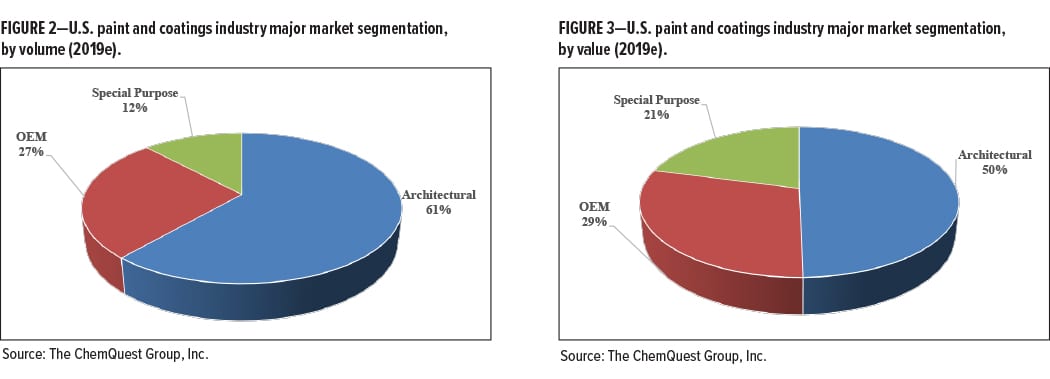
Architectural coatings sales are highly correlated with the health of the housing/construction market. The architectural paints segment currently accounts for 61% of the volume, and 50% of the value, within the coatings industry, compared to 60% and 49%, respectively, in 2017 (Figures 2–3).
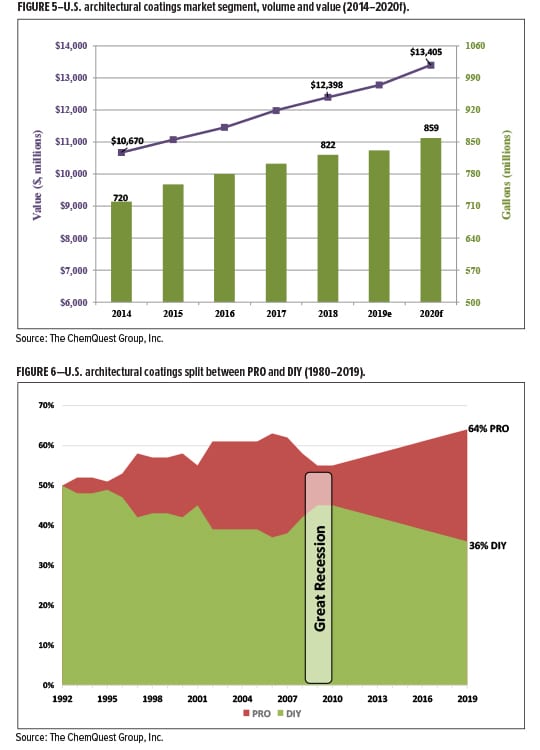
Architectural coatings grew 3.4% in value in 2018, with volume growth of 2.5%. Sales are forecast to rise 3.1% in 2019, based on an anticipated volume growth of 2.5% and an increase in selling price of 0.6%, resulting in volume of 832 million gallons valued at $12.8 billion (Figure 5).
The percentage of PRO-applied paint has continued to grow, unabated, since 2012, increasing the relationship of contractor-applied paint to Do-It-Yourself (DIY) paint to a ratio of 63% to 37% in 2018—the highest that this ratio has been since 2006 (Figure 6). Barring any unforeseeable economic events, this upward shift toward contractor-applied paints will very slowly continue through 2019, when it is likely to stabilize for a period of time around 63–64% PRO-applied paint.
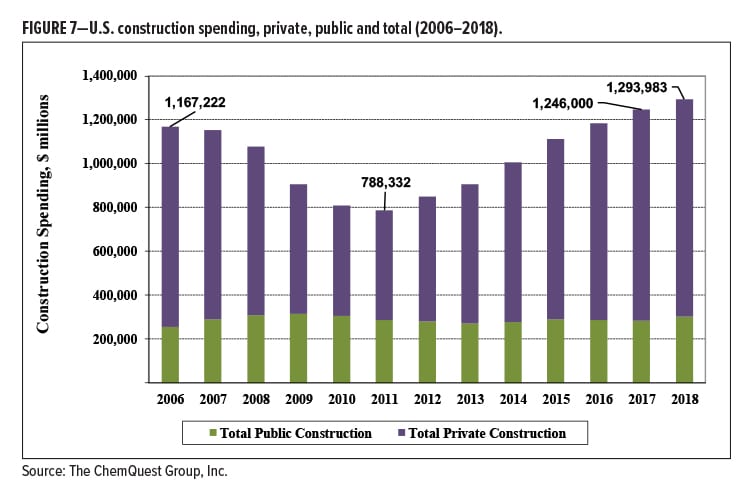
Because the architectural coatings segment is so intimately related to construction, it is positive news that construction in the United States continues its prolonged recovery from the unprecedented low point experienced in 2011. Total construction spending exhibited year-over-year (yr/yr) growth of 3.8% in 2018 and is anticipated to grow by ~3% during 2019, due principally to moderately decelerating growth rates in residential and non-residential (see Figure 7).
INDUSTRIAL OEM
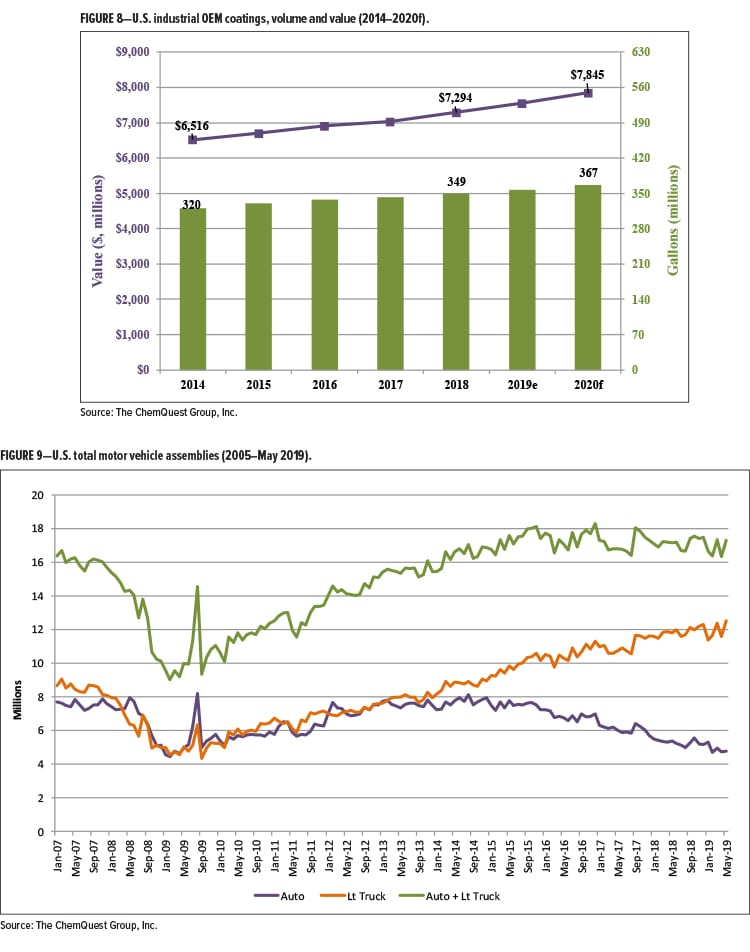
Industrial OEM coatings benefit from a pickup in industrial production. During 2018, the U.S. industrial OEM segment grew in value 3.7% over 2017 (+1.9% volume; +1.8% price), generating $7.3 billion in sales (~353 million gallons by volume). Volume in 2018 finally matched the most recent peak, which occurred in 2013. Industrial OEM coatings are forecast to increase by 3.4% in value in 2019, with volume and pricing up 2.0% and 1.4%, respectively (Figure 8).
The OEM segment increased nominally in 2018 by slightly less than 1% in the automotive sub-segment (defined as automobiles, light trucks, vans and SUVs; total of domestic production, transplants, and imports), but is forecast to decline by roughly the same amount during 2019 (Figure 9).
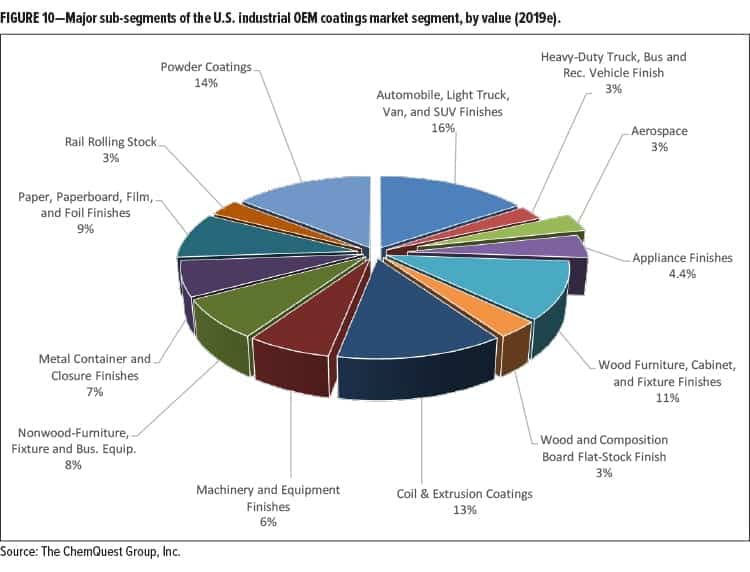
The OEM segment contains over a dozen sub-segments, of which appliances, HVAC, heavy equipment, microwaves, rigid and flexible automotive exterior trim systems, brake systems, coil coatings, and wood furniture and cabinets are just a few representative coatings areas (Figure 10). As a result of this diversity of goods, the industrial OEM segment tends to be driven by a variety of factors, although most are involved either directly or indirectly with the macroeconomic environment.
Major trends in the OEM market segment are driven by the need for products that create operational efficiencies (increase productivity/reduce labor/lower cycle times), increase sustainability (reduce CO2 footprint) and demonstrate innovation (infrared reflectance/noise reduction/insulation).
SPECIAL PURPOSE COATINGS
Special purpose coatings tend to track with automotive sales, accident rate, the size of the car parc (total number of registered vehicles in use at any given time), and total miles driven (refinish paints)—and industrial construction and the price of crude oil (protective/industrial maintenance coatings).
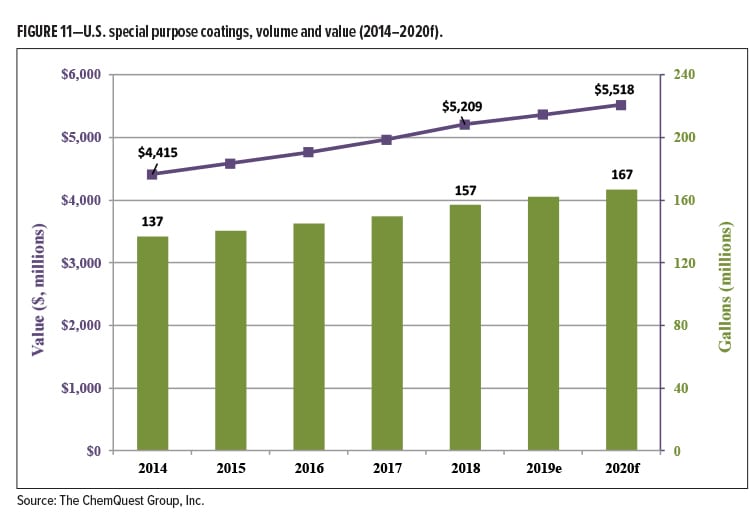
In 2018, special purpose coatings grew in value at a rate of 4.9% (+5.0% in volume; –0.1% in price), and contributed $5.2 billion (~157 million gallons) of the $24.9 billion generated by the U.S. paint and coatings industry. This represents only 12% of the volume, but 21% of the value, of all coatings produced. In 2019, we are expecting a moderate increase in the value of special purpose coatings, from $5.2 to $5.4 billion, with gallons increasing from 157 to 162 million gallons (Figure 11). This represents forecast sales dollar growth of 2.9% (+3.2% in volume but –0.3% in price).
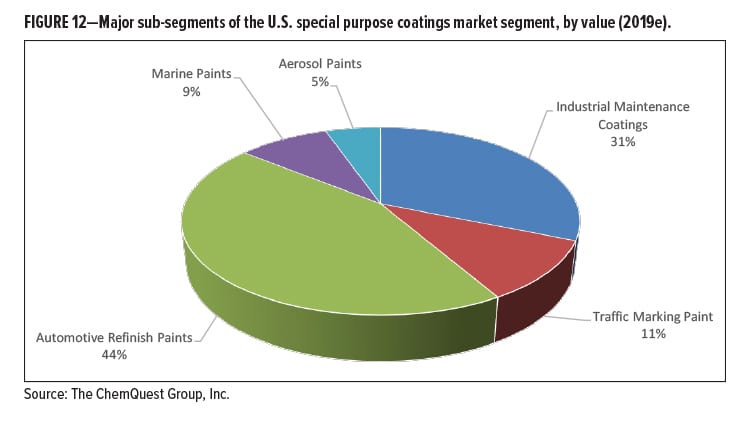
The special purpose coatings market segment serves far fewer end-market segments and sub-segments than are served by industrial OEM coatings, but—as an overall segment—typically commands higher margins than OEM coatings. The major end-markets for special purpose coatings include automotive refinish, industrial maintenance/protective coatings, traffic-marking paints, marine coatings, and aerosol paints (Figure 12).
Marine coatings are directly related to shipbuilding activity, which is cyclical in nature. Because shipbuilding is concentrated principally in South Korea, Japan and China (40%, 30% and 24%, respectively), this leaves only a 6% share of the global market for all other countries. For this reason, shipbuilding is not a driver for the sale of marine coatings in the United States, where marine coatings primarily address the needs of pleasure craft, military ships, platform and offshore supply vessels, etc. This market segment was valued at $460 million (9.6 million gallons) in 2018, up 2.9% in value and 1.1% in volume. Moderate growth is expected in 2019—2.8% in value, and 2.1% in volume.
Automotive refinish paints are indirectly tied to the number of miles driven and directly tied to the accident rates. Growth, therefore, of automotive refinish coatings is driven by a number of conflicting factors, including negative ones such as improved education of the populace with regard to safer driving habits, as well as the advent of safer and “smarter” cars that are making it easier for drivers to avoid accidents—and to minimize the amount of damage when an accident does occur—with an assortment of devices from energy-absorbing bumpers to back-up cameras and automatic controls that keep cars from accidentally crossing the center line. These negative factors are countered by positive factors, such as the increase in disposable income, changing lifestyle and buying behavior, and the demand for luxury vehicles, including crossovers and SUVs, since luxury car owners tend to have scratches and minor dings repaired on a luxury car than may have been the case in a non-luxury vehicle. Finally, the accident rate has been negatively impacted by the newest driving distractions in the form of activities such as talking and texting while driving and glancing at GPS screens. We believe that, over time, these various conflicting factors will settle down and work against the automotive refinish market, causing it to begin trending downward at perhaps 0.5–1.0% per year in volume during the period 2020–2023, as distractions are reduced and safety factors enhanced.
The protective coatings market segment (also referred to as the “industrial maintenance [I/M]” market segment) represented volume of 42.3 million gallons valued at slightly under $1.6 billion in 2018. Although volume from 2017 was down slightly (~1%), value was up by 6.2%. I/M coatings are tied very heavily to construction, maintenance of medium- and-heavy duty facilities such as petrochemical and wastewater treatment plants, infrastructure, and oil and gas production—and indirectly tied to the global price of crude oil, which ranged from $67–$76/barrel (global pricing) in 2018. The protective coatings sector benefitted, in 2018, from the uptick in construction activity that continued from 2017. Going into 2019, we expect to see the price of crude stabilize in the $67–$70/barrel range. Looking at 2019, we expect to see an increase in volume of protective coatings of 2.1%, and an increase in value of 2.6%.
2019 and Beyond
From a purely economic viewpoint, 2018 was a good year for the U.S. coatings industry value (+3.8%), and not all that bad for volume (+2.7%). Pricing outpaced volume by 1.1%, which means that the coatings producers were able to keep ahead of raw material increases, but not by award-winning numbers. Looking ahead to 2019, we can expect to see a similar scenario, albeit somewhat diminished in both volume and value growth—1.6% and 3.2%, respectively, with pricing outpacing volume by 1.6%. Growth, of course, is always good, but it is clear that the rate of growth is slowing, not just in the paint and coatings industry, but in the U.S. economy, in general. Nonetheless, the coatings industry value will outpace the anticipated GDP (2%) in 2019, but the performance of both will fall considerably short of robust—and that pretty well sums up the continuing crawl of the longest post-recession recovery in U.S. recorded history, which has lasted so long that it has become, for those with a taste for irony, the “status quo.”
The real question here should be, “Is the status quo good enough?” The answer depends entirely upon who is asking the question, and who is answering it. It’s certainly good enough for paint and coatings producers that only care about this quarter’s earnings, but it is most certainly not good enough for those companies that are less concerned about this year than they are about 5–10 years from now. The latter understand that the type of data in this article only has value when it is used to predict trends in the future, based upon the experience of the past, and a knowledge of the market dynamics and general mindset of the present. Such companies are quite aware that technology-based industries are constantly in need of newer, safer, more durable, more sustainable and more user-friendly products.
For these companies, it is certainly necessary to make money this year so that they are still in business next year—that’s pretty basic business sense, and it definitely requires some tactical maneuvering. They recognize, however, that year upon year of nothing but tactical decisions will eventually lead nowhere, and that there is a tombstone somewhere in the future with their name on it. The naked truth is that making money in order to stay in business this year is necessary—but creating new products to stay in business in the future is absolutely mandatory. We’ve all seen what happens to paint and coatings companies that lack a strategy for moving into the future, and what happens is that they cease to exist, either because they are acquired by a company with a strategy, acquired by a company without a strategy but with money to burn, or because they simply close their doors. For some, Door #1 appears reasonable—but who really wants to be forced into accepting what’s behind Doors #2 and #3? Unfortunately, like it or not, these are the options that are most readily available for paint producers that have only lived for moment, rather than for the long haul; that have sacrificed their future on the altar of the tactical.
The future is essentially written in stone for companies that are committed to this month, this quarter and this year—for companies lacking both vision and strategy to enable them to enter into the future. The long, slow, unexciting post-Great-Recession recovery period is nearing its inevitable end, and many of them will be among the victims claimed by the coming recession. For those companies with a concise, carefully considered and clearly articulated strategy for the future, however, their reward will be that they will weather the next recession and be the first out of the gate during the post-recession recovery, with exciting new products and processes for an eager and receptive marketplace.
Whether these companies create their strategies and new products on their own, or work with outside partners—whether business consultants or independent laboratories or both—is strictly a business call that will need to take both time and personnel resources into consideration. Both approaches have their merits, depending upon the situation. What matters is that they have a strategy and implement that strategy, because this is what separates the winners from the losers, and they will be the winners in the years following the next downturn in the economy.
CoatingsTech | Vol. 16, No. 8 | August 2019