By De Backer, M.P. Diebold, and M.P. Milone, The Chemours Company
While there is an intuitive connection between wall brightness and the electrical demand for illuminating a room, there has been little data reported to quantify this relationship. Here, we report the relative electrical load needed to light a room at the 500 lux level specified by European lighting standard EN12464-1:2011, as a function of wall brightness. A room was painted white, black, and two intermediate shades of gray, and room brightness was measured at multiple locations and directions using four light levels (controlled with a light dimmer), for both warm and cool fluorescent bulbs. Results were compared to computer modeling. Based on these results, we determined the expected electrical requirements for rooms painted with over a dozen “colors of the year,” as designated by major décor coatings manufacturers. The results were compared to the electrical requirement for a white wall. Significant energy savings are possible when painting a dark wall white.
INTRODUCTION
It is well known that reduction of electricity consumption in regions with hot summer climates can be realized by painting the exterior surfaces of buildings, particularly their roofs, white (or another bright color). This maximizes the reflection of solar radiation and so minimizes the amount of heat absorbed by these buildings. This concept is centuries old, but over the last decade it has received renewed interest and attention in the form of “white roof” or “white building” initiatives.1
While these benefits are well recognized, there is a second, less recognized, energy advantage associated with bright colors. This savings applies to the amount of electricity required to light a room brightly enough to carry out the tasks intended for that room. Depending on the location and orientation of the task (for example, writing on a table), and the locations of the light fixtures, a significant fraction of the incident brightness can be from light reflected by the room walls. Obviously, the brightness of the walls will affect the quantity of light reflected from it.
Electricity consumption for lighting is significant. In the U.S. residential sector, inefficient incandescent lights are being actively replaced with more efficient alternatives (primarily LEDs and compact fluorescent bulbs). However, this conversion is far from complete. At the end of 2017, more than half of the bulbs used in residential lighting were still incandescent.2 That year, 9% of total residential energy consumption was for lighting.3
Although Europe is overall more complete in their conversion from incandescent bulbs to more energy efficient light sources, a significant amount of electricity is still consumed there for residential lighting. In 2017, 13% of electricity used in the UK was for all lighting.4 Energy consumption for lighting in Continental Europe is more difficult to quantify because lighting is combined with electrical appliances in EU energy use statistics. Globally, however, it is estimated that all lighting accounts for 15% of total energy consumption, and that lighting demand will increase 50% between 2015 and 2030.5
Painting a room with a bright color results in both direct and indirect electrical savings. The direct savings are obvious—as brightness increases, less light is needed. Indirect savings are obtained during periods when the room is actively cooled. The ultimate fate of most of the light generated in a light fixture is heat. This is especially true for incandescent lamps, where as little as 2% to 3% of the incoming energy is converted into visible light; the rest is released as heat. By decreasing the energy used to generate adequate light, we decrease the electrical load on the cooling system.
We can compare the electricity used for lighting to that used to cool buildings. In the United States, it is estimated that 9.6% of the electricity used residentially in 2017 was for cooling.6 Globally, in 2017, 10% of overall electrical usage was for cooling.7 While both types of energy consumption are roughly equal, we note that cool roofing is a topic of current interest to the public, while bright rooms is not.
That said, architects are aware that reflectivity affects room brightness, and during building design sometimes include wall reflectivity in their calculations to determine the number and location of lighting fixtures. The basis of these models is theoretical. These models have been used to optimize lighting in office settings,8 but to our knowledge, there has been no experimental data reported that measures the energy required to adequately illuminate an actual room as a function of wall brightness.
In this article, we detail the results of our experiment to determine electric energy requirements as a function of wall brightness for an average size interior office room. We then compare the results of our experiment to results calculated by a well-known architecture software model.
EXPERIMENTAL
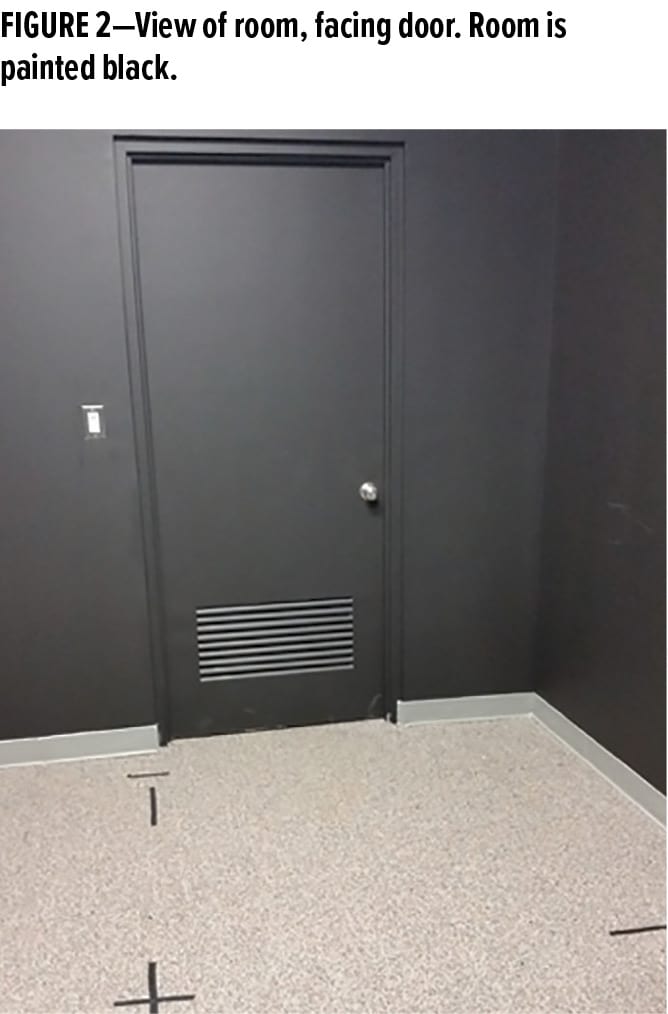
An interior office was painted with achromatic paints of four brightnesses: brightest white, two shades of gray, and black. The tristimulus Y reflectance values for these paints are 91, 60, 20, and 5, respectively. A schematic of the room, showing the measurement and light fixture locations, and a picture of the room, painted black, are shown in Figures 1 and 2. The room had a standard acoustical tile ceiling (tristimulus Y reflectance value of 84) and mid/dark carpeting (tristimulus Y reflectance value of 35). The ceiling height was 3.0 m, and most measurements were made 90 cm from the floor. The exceptions were measurements made 60 cm underneath each lighting fixture. These measurements were used to determine the luminosities of the light sources, with the intention being that all light measured at those positions comes directly from the light sources, rather than being reflected from the walls.
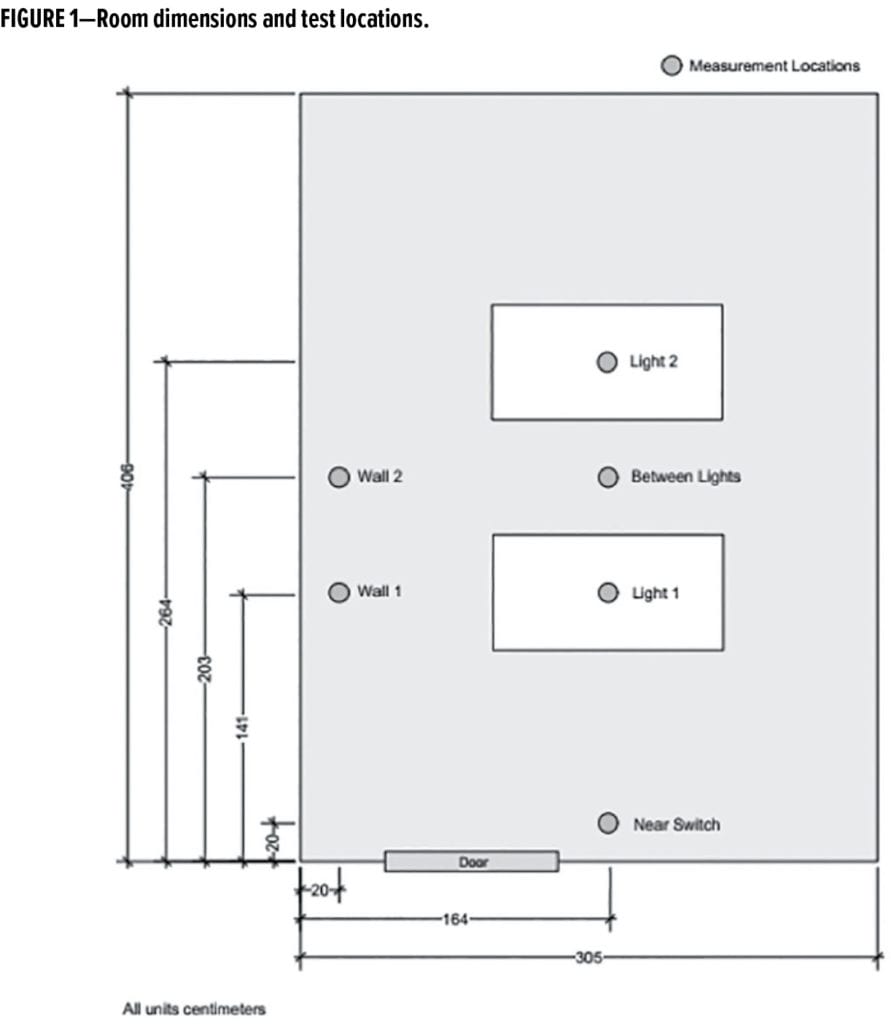
Luminance was measured at six locations in the room, with the meter oriented at different angles for these locations (e.g., Horizontal, 45°, facing the nearest wall or facing the interior) and with two different dimmable fluorescent bulbs (25 W 4100K and 32 W 6500K). There were two light fixtures in the room, centrally located, and each fixture accommodated four bulbs. A diffusion panel was placed on each fixture. Within a set wall brightness and bulb type, four electrical power levels were explored at each location and orientation. Brightness was varied with a standard light dimmer.
A total of 776 brightness values were measured, including one set of measurements done in triplicate. These were of the lighter gray room using the 4100K lamps and measuring at all room locations and orientations. From this we calculate an average standard deviation of 14.1 lux for light intensity and 0.5 Watts for the power setting.
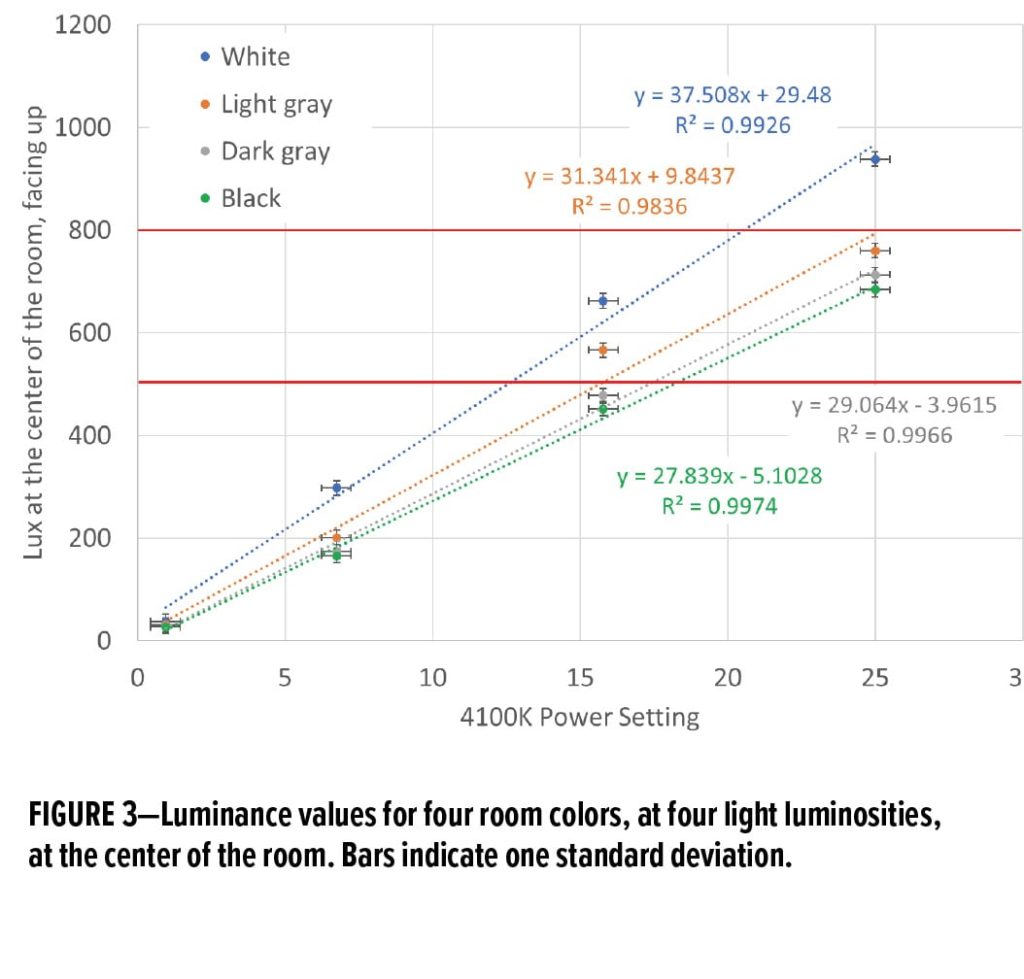
Typical results are shown in Figure 3. Here we display luminance values (on the y-axis), for each room color (separate line), for the middle of the room with an up-facing orientation of the light meter, as a function of the four different dimmer settings (on the x-axis) for the 4100K lamps. Lux values of 500 and 800 are highlighted in red. These span the values typically recommended for reading and other activities (see below). As indicated by the high Pearson R-squared values given in Figure 3, there is an excellent linearity between the power setting and the luminance value for each wall color. For these data, an R-squared value above 0.980 (R value above 0.990) is significant at the 0.01 level. This condition is met by all four experimental lines in Figure 3, confirming that the relationship between light intensity and power is linear over this range. Linearity is expected as it indicates that the illumination efficacy of a light does not change with power over the range we studied.9
RESULTS AND DISCUSSION
We intentionally used an interior room, rather than one with a window, in this study. A window would add complexity and confound the results. We would expect less electricity use during the day, when the room benefits from a bright outdoors, but significantly more electricity use at night, when most of the light falling on the windows is lost to the outdoors. The balance between savings during the day and losses at night is difficult to quantify since it depends on the room’s use (work or home), the length of the day, and the number of active hours during daytime and nighttime. In addition, many offices do not have windows—in a 2015 survey of office employees, 61.2% reported that they did not sit near a window and so had very little natural light.10
Our interest is in two lux levels: 500 lux, which is specified by European lighting standard EN12464-1:2011, and 800 lux, which was preferred by 60% of European office employees in a 2015 survey6 and is recommended for workers 45 years or older.11 We found that the response of luminance to power level to be linear in all cases (see Figure 3 for an example), and so the percent extra electricity needed to illuminate the room to 500 lux, for a given room color and lamp type, is the same as the percent extra electricity needed to illuminate the room to 800 lux (that is, luminance is linear with electrical power).
The luminosity of the lights at each of the four light settings was determined by placing a photo meter directly below each light fixture. This was measured for each room color, to confirm that the radiation being measured was entirely from the lights themselves, with only an insignificant amount, if any, coming from the walls. This was confirmed to be the case.
Our analysis included all data points, but for brevity not all of these points will be detailed in this article. Instead, we will focus on a subset of results that we believe to be representative of the entire data set. This subset consisted of:
- Room center; meter oriented facing up; 4100K bulbs
- Room center; meter oriented at 45°; 4100K bulbs
- Against the wall (“Wall 2” in Figure 1); meter oriented facing up; 4100K bulbs
- Against the wall (“Wall 2” in Figure 1); meter oriented at 45° into the room; 4100K bulbs
Our reason for analyzing these particular locations and orientations is that we believe them to be relevant to different usages of the room. If the room is used as a conference room, then the most likely location for a table would be the center of the room. If it is used as an office, then the most likely location for a desk would be along a wall. The two different orientations (facing up and at 45°) are those used for observing an object flat on the table or desk, or for holding a book at these locations.
Our chief interest in this work is to determine the relative amount of extra energy needed to illuminate the room to the same level for different wall darkness. We consider the white room results to be the baseline, with an assigned value of 1.0, and calculate how much more energy, relative to the baseline value, is required to illuminate the room to the same level of brightness as the white room. Averaged values are reported in Table 1 and plotted in Figure 4. Note that one data point was omitted from our analysis—the room center, at 45° orientation, for the light gray room—because it was anomalous.
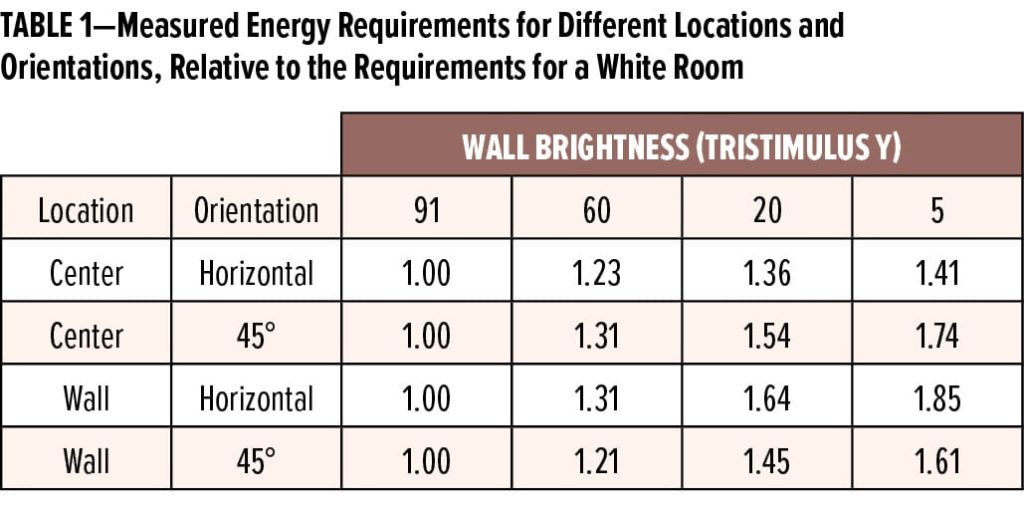
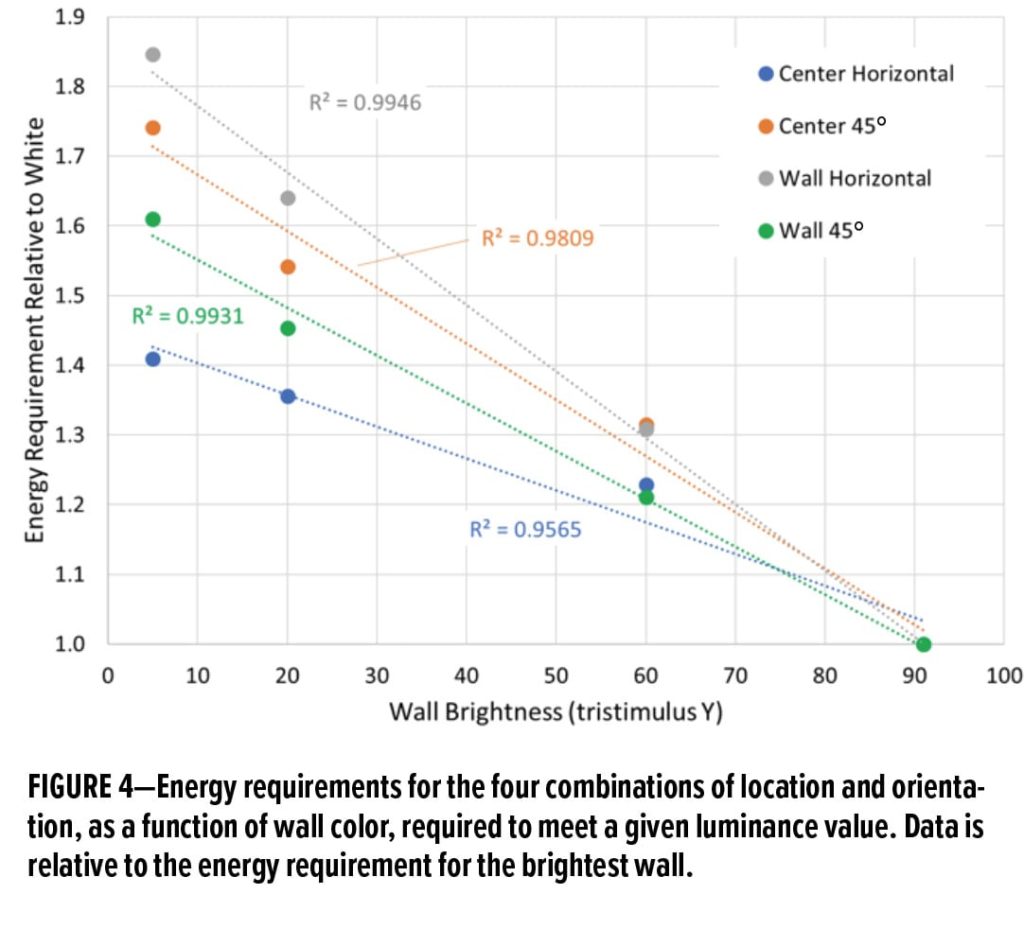
Results for the room center, with the meter held horizontally, were the least sensitive to wall brightness. This is expected since this is beneath the lights, and so most illumination will be directly from the source. The wall location, facing 45° into the room, was the next least sensitive. Here the meter was pointed nearly at the lights, but since this location is further away than the center location, the electrical need is greater than for the center location. The location and orientation most sensitive to wall brightness was the wall, facing up. This is understandable since a significant portion of light striking this surface will come from the wall.*
Overall, we find that, for the black paint, between 41% and 85% additional lighting is required compared to the white room. While this is an extreme case (rooms, especially those with no windows, are seldom painted black), even for a light gray paint, between 21% and 31% additional lighting is required compared to the white room. This is a significant increase in electricity requirements which, as detailed above, constitutes a significant portion of the overall electricity demand globally.
We will discuss the implications of these results to real world room colors below.
*We can see this by imagining that the wall is a mirror. In this case, roughly half the illumination will come from the lights in the room, and half from the lights in the mirror. Replacing the mirror with black paint, therefore, is expected to decrease illumination at the wall by roughly half.
MODELING
Modeling was done using DIALux software.12 This software is widely available and heavily used by architects and building designers.
While we would have liked to model each of the four room locations and orientations, this software is limited to modeling only horizontal orientations. In addition, the minimum wall brightness was 0.10, rather than the 0.05 that we achieved experimentally. We, therefore, modelled the horizontal center and wall locations at wall reflectance values of 0.90, 0.60, 0.20, and 0.10. The light sources available for modeling did not match either of our two lamps, and so a 32 Watt fluorescent, 5208K source was used in the model. This should have no impact on our conclusions, since we are concerned with analyzing energy needs on a relative basis (relative to bright white) rather than an absolute basis.
As was done with the experimental results, we report, in Table 2, the relative electricity requirements at equal brightness, for the four wall colors, at each of the two locations. This data is shown graphically in Figure 5.
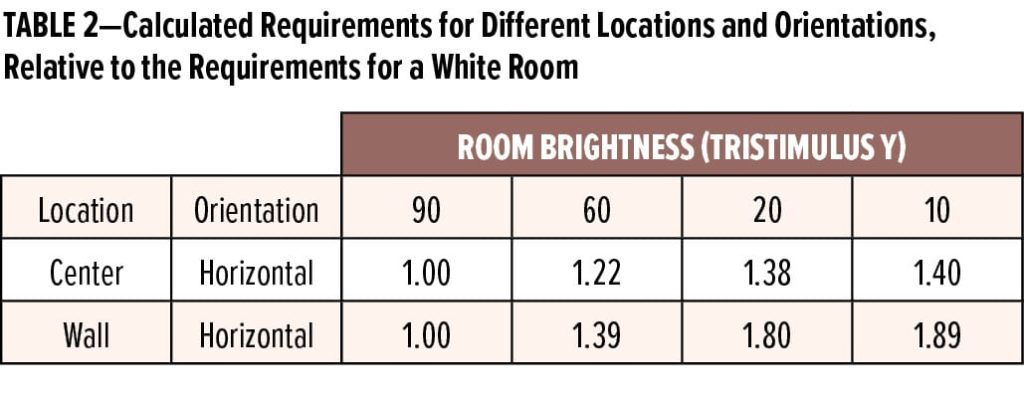
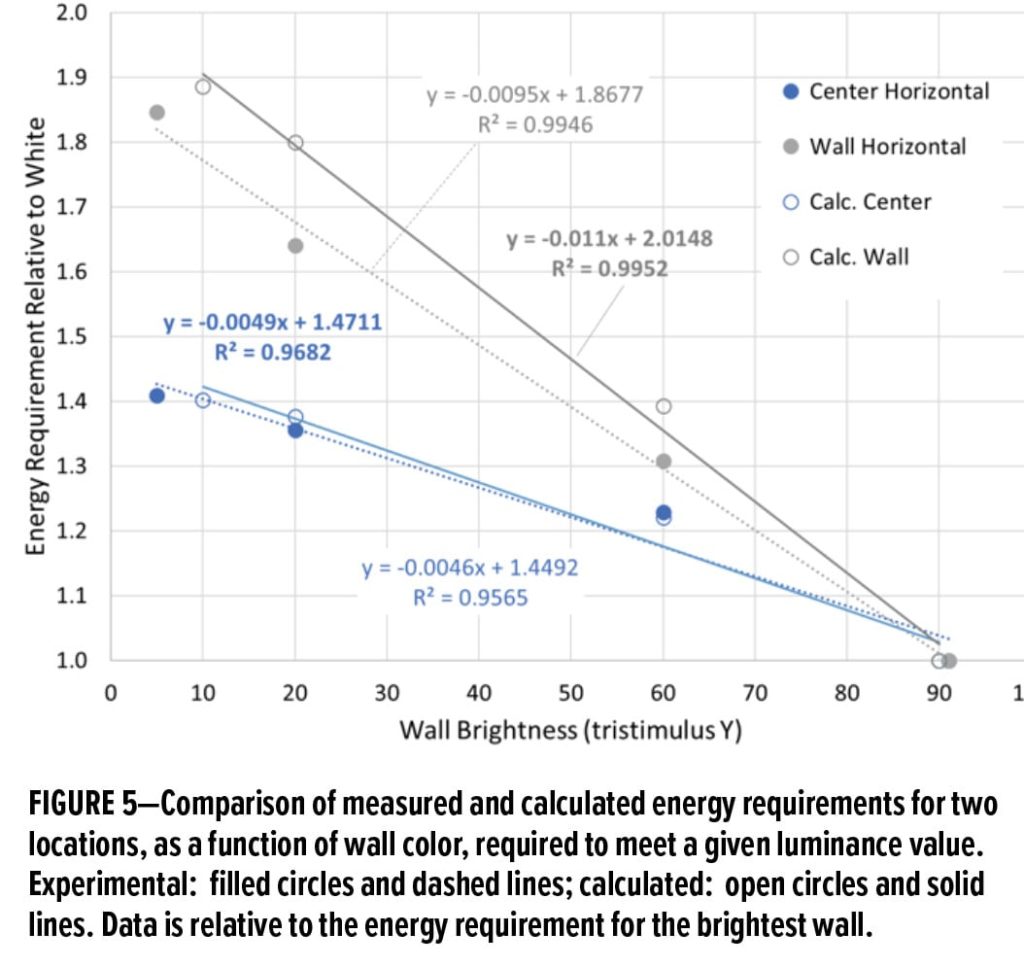
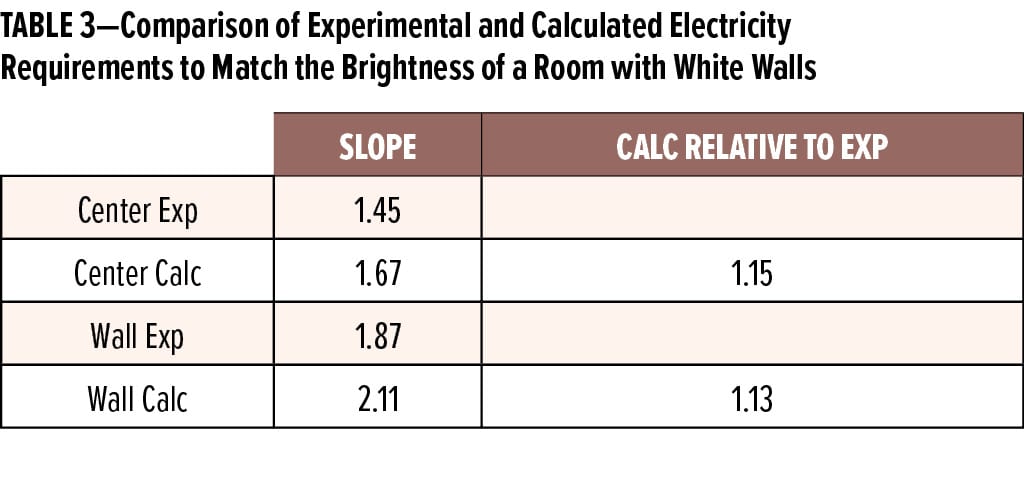
Comparing the results in Tables 1 and 2 graphically (Figure 5), we see that the model agrees well with the experimental results for the center reading, but is 8% higher than the experiment for the measurement near the wall. This is seen in the slopes of the best fit lines in Figure 5 (see Table 3). The slope of the line is a measure of the sensitivity of the brightness at that location and orientation to wall darkness. Assuming that our results are representative of most offices, this suggests that architects may be specifying brighter light intensities than is necessary in some cases. We cannot offer an explanation for this discrepancy, since we do not know the details of how the model bases its calculations.
IMPLICATIONS FOR PAINT CONSUMERS
Color is a leading consideration for interior architectural (décor) paints, and color choice is quite often the first question asked of a customer entering a paint store. While statistics are not available as to which colors are popular among business and home owners, the traditional choice is an off white. However, many interior designers recommend darker, bolder colors to their clients as a way to stand out and make a fashion statement. This is reflected in the choice of “color of the year” made by many interior architectural producers. We have collected 19 of these colors from the last two years. Tristimulus Y values and corresponding L* values for these paints are given in Table 4.
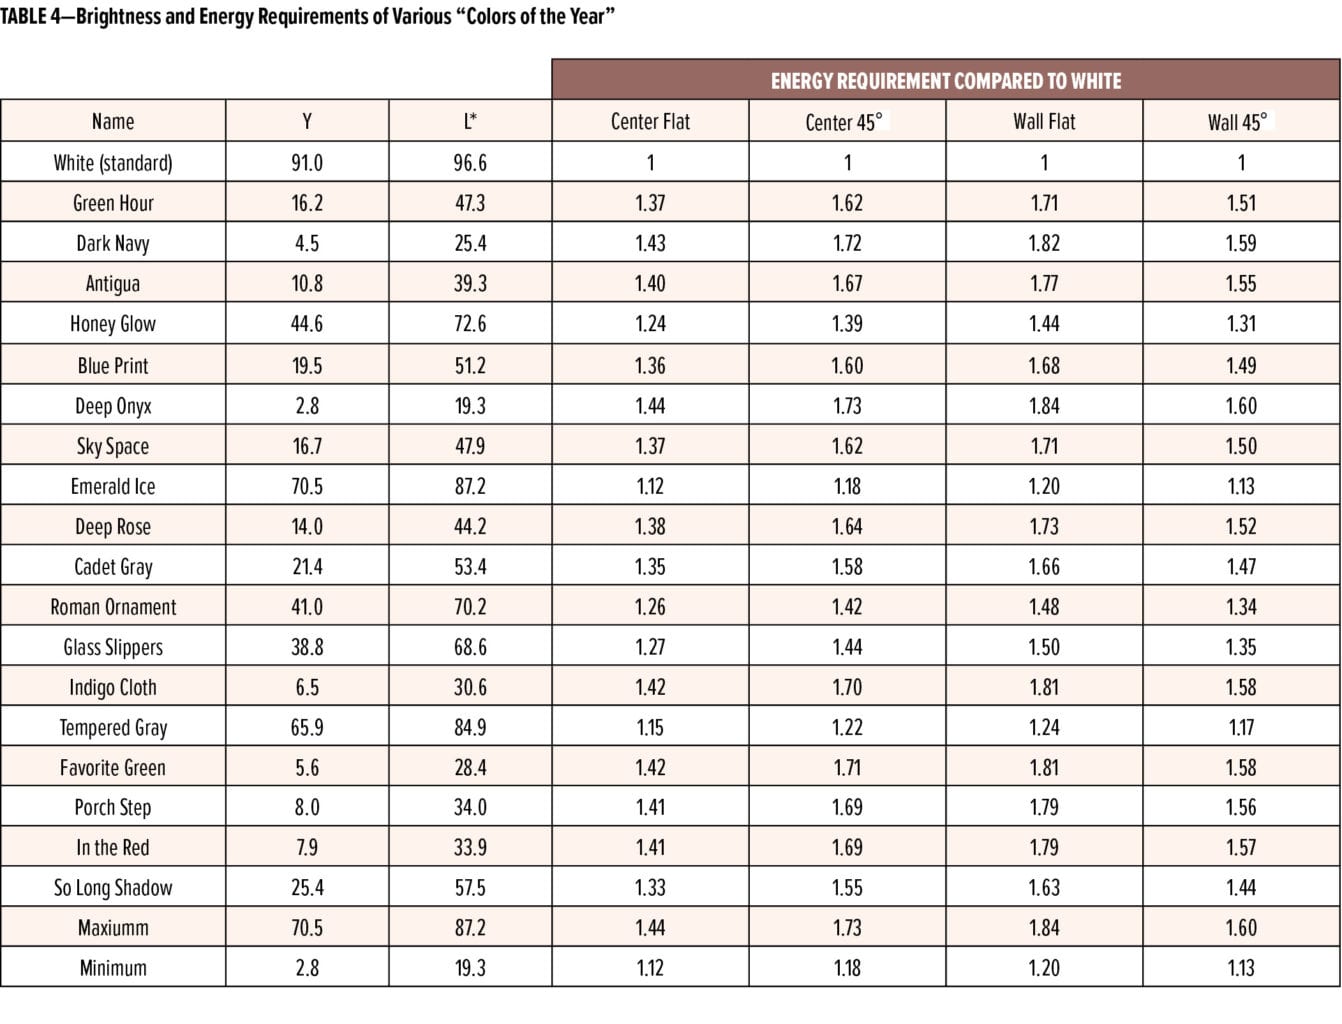
As can be seen from Table 4, the “color of the year” paints are relatively dark (the average tristimulus Y value is 23.3 and an average L* value of 49.8). This is consistent with many of their names, such as “Dark Navy” and “Deep Onyx.”
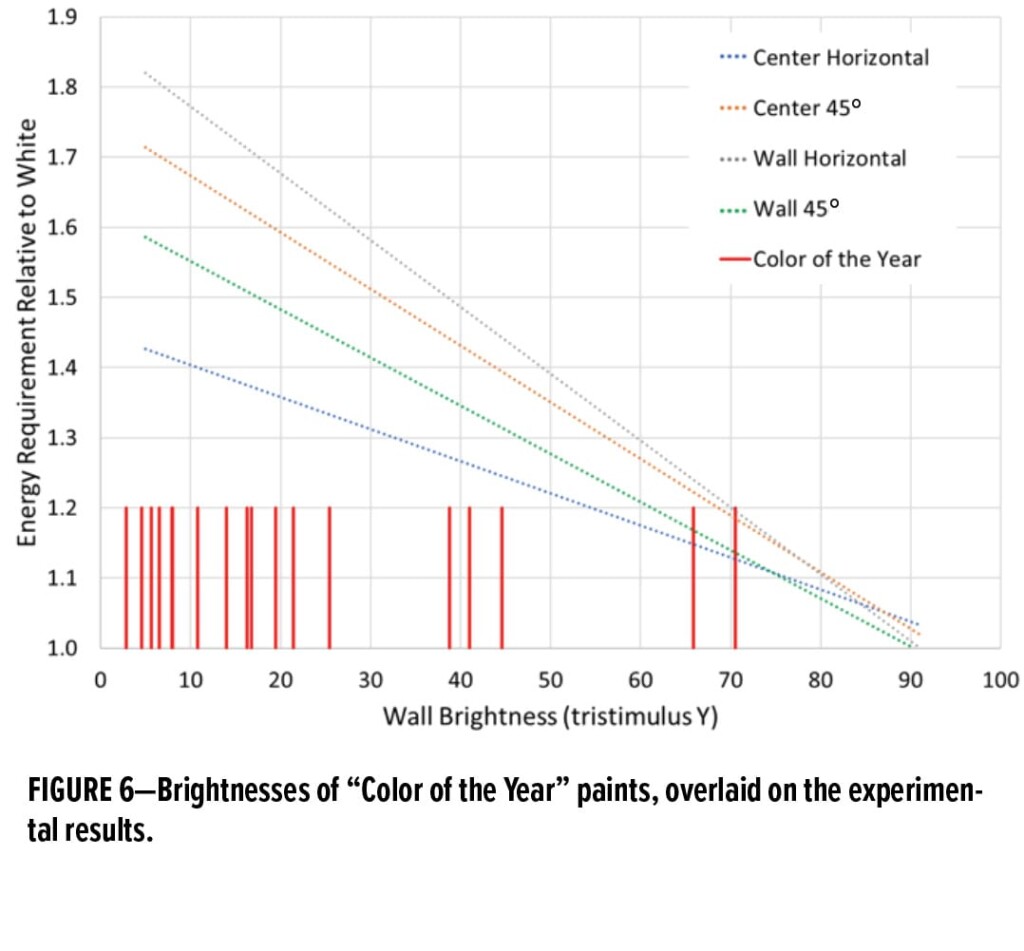
To estimate the lighting costs associated with these colors, we have indicated their reflectance values in Figure 6 along with the best fit lines for the four location/orientation pairs that we analyzed (from Figure 5). We tabulate the additional electrical load for the four location/orientation pairs for our room in Table 4. We see from this table that the additional electricity requirements for these paints vary from 12% to 84% versus white walls. It is clear that the additional electricity burden of using relatively dark paints on interior walls is very real.
ECONOMIC AND ENVIRONMENTAL CONSEQUENCES
From our data we can calculate the monetary cost of lighting rooms with bright walls over rooms with dark walls. While electricity cost varies globally, we will calculate these costs for one specific region as an indicator of the value of bright walls in general. For this calculation we will use data from the United States, where the average user cost of a kilowatt hour of electricity is $0.133.13 We assume that the room is used five days a week for nine hours per day.
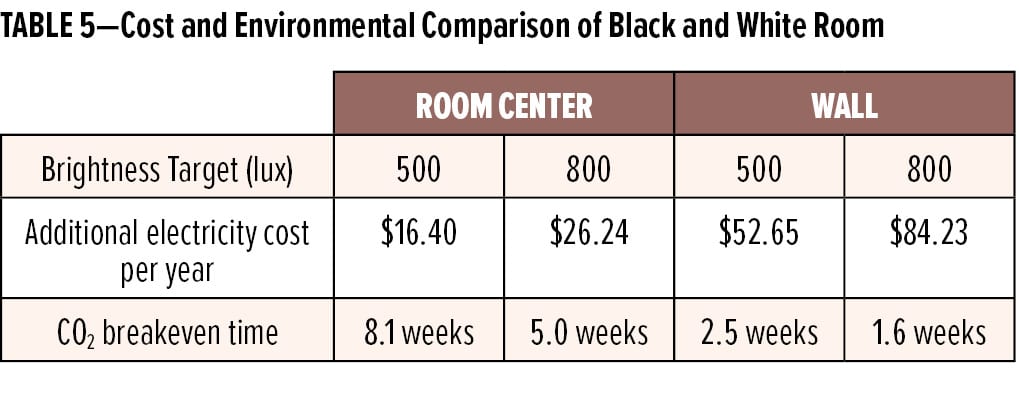
The results of these calculations for our room are shown in Table 5, averaged over the two light types. Here we consider two lighting levels (500 lux and 800 lux) and two measurement locations (wall and room center, both oriented up). The financial cost of a dark room, compared to a white room, is substantial—over one year, the additional electricity cost of the black room varies from $16.40 to $84.23, depending on lighting level and where in the room light intensity is measured. Over the service life of the paint, the additional cost of lighting a black room far exceeds the initial cost of the paint, and the cost of using greater amounts of TiO2 to brighten a room is quickly offset by the electricity savings.
In addition to the monetary cost of a dark wall, there is an important environmental cost. This cost is the amount of CO2 released to the environment, both in making the TiO2 pigment and in generating the electricity consumed by the lights. We can quantify this cost in terms of a payback period—how long it takes for the CO2 savings from using less electricity to offset the CO2 generated when making the TiO2 white pigment. For this calculation, we assume that each kilowatt hour of generated electricity results in the release of 0.71 lb of CO2,14 that the white paint contains 2.5 lb of TiO2 per gallon, and that production of each pound of TiO2 results in the release of 5.0 lb of CO2.
As seen in Table 5, this environmental payback period is quite short—a little over eight weeks for the least sensitive location (room center) at lowest illumination target, and less than two weeks for the most sensitive location (at the wall) and highest illumination level.
COMPARISON TO WHITE ROOF ENERGY SAVINGS
Over the years there have been numerous initiatives to decrease electrical consumption, both to reduce cost and to protect the environment. One such program is the cool roof (or white building) initiative. The concept is straightforward—by replacing dark roofs with light roofs, much solar energy can be reflected away from a structure, rather than be absorbed in to it in the form of heat. This could significantly decrease the cooling burden on the structure during hot summer months.
Note that this not only results in less overall electricity use, but it does so during peak electricity demand times, since in many cities the greatest electrical use occurs on the hottest days of the year. By decreasing peak demands, the number of power plants needed to service a city will be fewer, since this number is determined by the peak (maximum) electricity requirement, rather than the average requirement.
An estimate of the electricity savings gained by increasing the albedo of roofs from a solar reflectance value of 0.2 to a value of 0.6, in 27 cities around the globe, was reported in 2007.15 These savings are, of course, greater in cities characterized by very hot summers than in more moderate climates. Overall, the summer electrical savings were estimated to be between 11% and 75% for this level of brightness increase. These estimates are quite comparable to the savings potential we estimate for painting rooms with bright colors, reinforcing the consequences of using a dark interior color to overall electricity consumption.
CONCLUSIONS
Our work quantifies, for our test room, the relative energy required to meet lighting targets as a function of wall reflectance. While we studied only one room, we believe the conclusions we draw from it to be valid for similar rooms, at least at the semi-quantitative level.
We found that the amount of electricity required to light the room to 500 lux, the minimum level generally accepted as adequate for office work, and 800 lux, the level preferred by many, correlates very strongly with the brightness of the room paint. This energy demand was linear over the range we studied. Electricity requirements increased by as much as a factor of 1.85 between the bright white and black paints.
While this is an extreme brightness range (very few rooms are expected to be painted black), some “colors of the year,” as chosen by paint manufacturers, are quite dark. For the colors that we examined, we estimate the additional electricity requirements for them, relative to the requirement for a white wall, to vary by factors of 1.12 to 1.84. These values are quite significant—as a point of reference, depending on location, cool roofs are estimated to reduce cooling costs by between 11% and 75% when the reflectivity of the roof is increased from 0.20 to 0.60. On a percentage basis, these savings are quite comparable to the electricity savings we demonstrated for a bright white room compared to a room painted with a “color of the year” (between 12% and 84%).
The increase in electricity consumption for dark rooms comes at a cost—both financial and environmental. The annual additional cost of lighting a dark room ranges, for our room, from $16.40 to $84.23, depending on how the room is used (office or conference room). As for environmental considerations, our analysis showed that there is a very fast breakeven time (a few weeks) for both the monetary cost of the TiO2 used in the white paint and the CO2 released in the production of the TiO2.
We also found that a popular architecture modeling program overestimated the effect of wall color on lighting needs by up to 8%. Relying on this model alone would lead to brighter lighting than necessary, but at the expense of additional cost and environmental burden.
While personal preference will always be a major factor in color choice, it is important that the consumer be aware of all costs of a given color option—not only in terms of monetary costs (in the form of higher electricity bills), but also environmental costs (emissions from power plants). Those consumers wanting a “green” paint may find the color they are looking for is, in fact, white.
References
- “Cool Roofs,” https://www.energy.gov/energysaver/energy-efficient-home-design/cool-roofs.
- “Annual Energy Outlook 2018,” https://www.cooperative.com/news/documents/eia-annual-energy-outlook-2018.pdf).
- “How Much Electricity Is Used for Lighting in the United States,” https://www.eia.gov/tools/faqs/faq.php?id=99&t=3.
- “Energy Consumption in the UK ECUK 2018,” https://assets.publishing.service.gov.uk/government/uploads/system/uploads/attachment_data/file/729317/Energy_Consumption_in_the_UK__ECUK__2018.pdf).
- “Rise and Shine—Lighting the World with 10 Billion LED Bulbs,” https://www.energy.gov/articles/rise-and-shine-lighting-world-10-billion-led-bulbs).
- “How Much Electricity Is Used for Cooling in the United States,” https://www.eia.gov/tools/faqs/faq.php?id=1174&t=1.
- “Air Conditioning Use Emerges as One of the Key Drivers of Global Electricity-Demand Growth,” https://www.iea.org/newsroom/news/2018/may/air-conditioning-use-emerges-as-one-of-the-key-drivers-of-global-electricity-dema.html.
- “The Impact of Artificial Light in Architectural Spaces,” Thesis, Ana Teresa Luis Negrao, https://fenix.tecnico.ulisboa.pt/downloadFile/395145552805/EXTENDED%20ABSTRACT_Ana%20Negr%C3%A3o_2013.pdf.
- “Lux, Lumens and Watts: Our Guide,” https://greenbusinesslight.com/resources/lighting-lux-lumens-watts/.
- “New Zumtobel Research on Lighting Quality Perceived in Offices,” https://www.thefuturebuild.com/news/new-zumtobel-research-on-lighting-quality-perceived-in-offices.
- “Philips Lighting Questions Proper Light-Level Standards for Office Workers,” https://www.ledsmagazine.com/articles/iif/2015/03/philips-lighting-questions-proper-light-level-standards-for-office-workers.html.
- “DIALux family for lighting designer and manufacturer,” https://www.dial.de/en/dialux.
- “Greenhouse Gases Equivalence Calculator,” https://www.epa.gov/energy/greenhouse-gases-equivalencies-calculator-calculations-and-references.
- “Electricity Rates by State (Updated March 2019),” https://www.electricchoice.com/electricity-prices-by-state/.
- Synnefa, A., Santamouris, M., and Akbari, H., “Estimating the Effect of Using Cool Coatings on Energy Loads and Thermal Comfort in Residential Buildings in Various Climatic Conditions,” Energy and Buildings 39 (2007) 1167–1174 (10.1016/j.enbuild.2007.01.004).
CoatingsTech | Vol. 16, No. 9 | September 2019
