
By Christopher J. Lyons, Defence Science and Technology Group
A waterborne two-pack polyurethane finish coating formulated for military aircraft provides extended durability performance suited for Australia’s harsh climate as well as substantial reductions in content of volatile organic compounds when compared with high-solids solvent-based aerospace coatings. A formulating practice using commercially available hydroxyl-functional polyurethane dispersions combined with hydrophilically modified polyisocyanate resins enables compositions to be made that are suitable for spray application, have drying properties useful for aircraft workers, and cure to form films with the specified resistance and flexibility properties.
INTRODUCTION
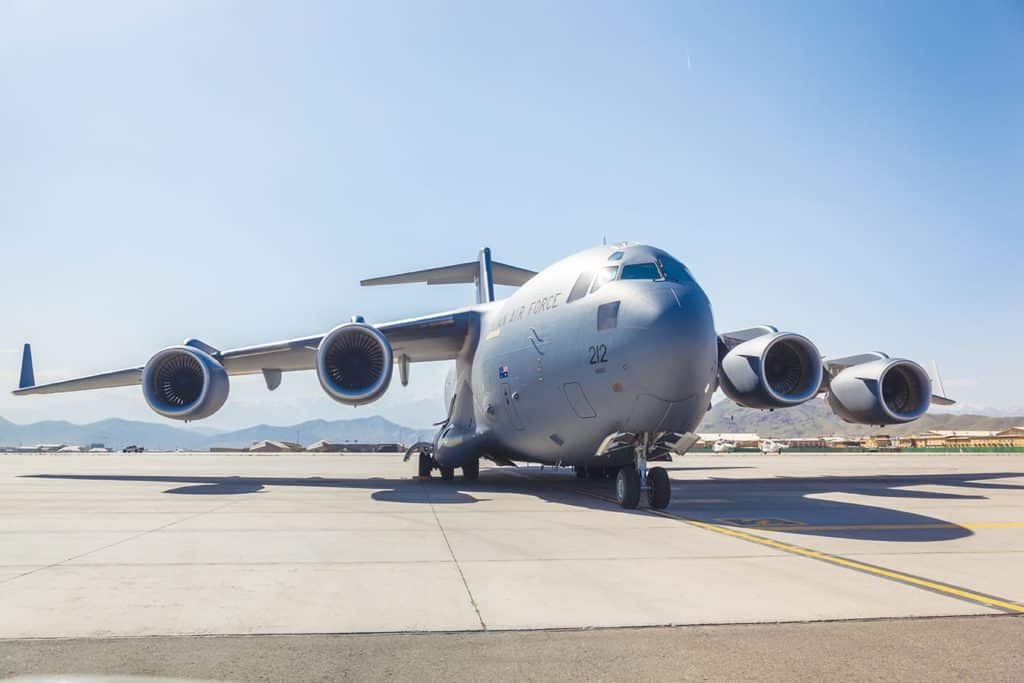
Two-pack solvent-based polyester polyurethane coatings have been the principal topcoat products used on military aircraft for several decades. These form the top layer of the coating system used over aluminum alloy substrates on military aircraft (Figure 1). The other layers include a pretreatment and a two-pack epoxy primer that provide anticorrosive protection for the substrate. The topcoat provides a range of important properties, such as color and camouflage, chemical resistance, and exterior durability. The topcoat must have good adhesion to the primer and also protect the primer from environmental degradation.
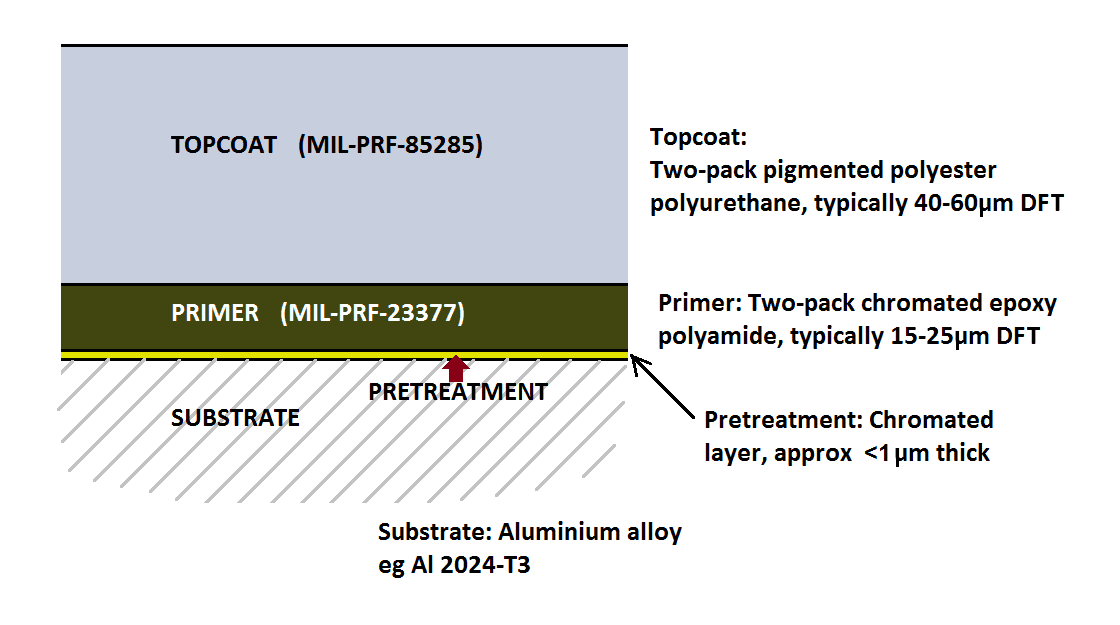
FIGURE 1—The layers of a typical aircraft paint system.
Most exterior topcoats currently used by the Royal Australian Air Force (RAAF) are covered by the U.S. military specification MIL-PRF-85285E,1 which includes requirements for high-solids (HS) products and which limits content of volatile organic compounds (VOC) to a maximum of 420 g/L. HS products from the United States were introduced gradually over the period from 2000–2010 until they replaced the older two-pack topcoats completely. These older topcoats, which conformed to the U.S. specification MIL-C-83286B,2 and which were also required to pass the performance testing in the RAAF paint system specification K62,3 typically contained VOC levels in the range 600 ± 50 g/L, and will be referred to here as “conventional solids” (CS) topcoats.
However, significant complaints were received by Defence Science and Technology (DST) Group about the poor durability of the HS technology topcoats, with faster changes occurring to gloss and color due to environmental exposure degradation than had been observed for the CS products, and substantial chalking that significantly affected their appearance. The U.S. specification MIL-PRF-85285D4 introduced categories of coatings allowing for two different classes: Class H for the HS solvent-based products and Class W for waterborne (WB). In addition, there were three different types classified according to VOC level. Types I, II, and III specified maximum VOC levels of 420, 340, and 50 g/L respectively, with only limited requirement for weatherability using a Xenon arc weatherometer for 500 h.
Type IV coatings first appeared in an amendment to MIL-PRF-85285D,5 and then finally in the fully revised specification MIL-PRF-85285E,1 in recognition of the deficient weatherability of Types I, II, and III. This new category arose out of exterior durability studies undertaken by the Organic Coatings Team at Naval Air Systems Command (NAVAIR) in conjunction with paint companies formulating products for exterior durability testing on military aircraft.6 Type IV has a maximum VOC level of 420 g/L with the additional requirement for “extended weatherability” and bolsters the requirement for testing in a Xenon arc weatherometer to 3000 h.
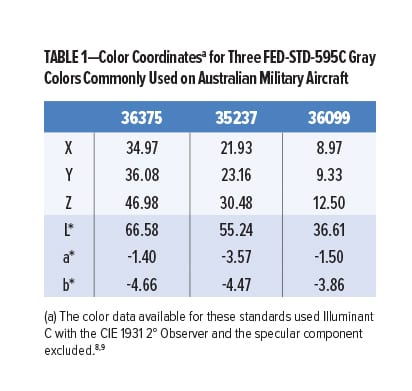
Exterior durability testing of Type I and Type IV products from the major U.S. paint companies in three different gray colors has been undertaken by DST Group in Australia.7 These three colors are listed in Table 1 together with the tristimulus values obtained from the Federal Standard MIL-STD-595C,8 and the CIELAB color coordinates from the original standard MIL-STD-595A9.
 Results of exposure testing, both in temperate Victoria in the south and the tropical conditions of northern Queensland, have shown that the Type IV products for each company are indeed more durable than their Type I counterparts, and some of these are in the process of being introduced into service by the RAAF. However, the performance of the different Type IV coatings of a particular color from different paint companies varies widely. Attempts to correlate the results of accelerated weathering testing with the exterior exposure results have met with limited success and will not be discussed here. Weathering results in this article will focus on exterior testing for one color only, this being FED-STD-595C-36375.8
When aiming to reduce VOC emissions from coatings as much as possible, a move to formulations that use water as the primary solvent is one logical route to consider. A high level of effort has been expended by chemical companies over the last few decades in developing new products suited for high-technology waterborne coatings, and the effort continues despite the slow uptake of these materials in the industrial and automotive sectors.
The ability to formulate waterborne products that cure to form finishes that perform the same as, or better than, the solvent-based products, continues to be an active field of endeavor for the paint formulator. To date, only one commercially available waterborne finish camouflage coating for military aircraft appears to have been qualified to MIL-PRF-85285E, and has been designated as a Class W Type III coating.10 In the present study, a waterborne coating technology is demonstrated that has excellent exterior durability performance, outlasting the best of the Type IV products, while meeting the other test requirements of MIL-PRF-85285E, except for reverse impact flexibility, which will be discussed.
EXPERIMENTAL
Approaches to Formulating
The particular waterborne formulations developed and the ingredients used, for which results are presented in this article, are proprietary and cannot be disclosed here; however, the general approach taken to making the paints is addressed in the following.
Raw materials were sourced from a variety of suppliers. Samples of hydroxyl-functional latexes, including certain polyurethane dispersions (PUDs), were offered as potential candidates providing the degree of chemical resistance and flexibility for the intended application when crosslinked into paint films. Several of these latexes were made up into Component A formulations, mixed with Component B (see below), drawn down, and allowed to cure under ambient conditions for at least seven days. Based on preliminary results, which included examining the best balance between rate of dry, chemical resistance, and flexibility, one particular PUD—a hydroxyl-functional aliphatic polyester polyurethane dispersion—was selected for all the subsequent tests undertaken in this work.
Latex-free pigment dispersions were made up into water-based pigment concentrates using durable pigments and a suitable dispersant system under high-speed dispersion followed by glass bead milling. The full Component A formulations were made up by stirring appropriate quantities of the pigment dispersions into the bulk latex, dispersing in the flatting agents, and then making up with a range of functional additives and adjusting with deionized (DI) water. The additives include surface additives such as substrate wetters and leveling agents, defoamers, adhesion promotors, and a hindered amine light stabilizer. In some cases, color adjustment was accomplished with commercial pigment concentrates containing lightfast and heat-stable pigments.
Two colors were made up and matched to two Federal Standard 595C colors: a light gray (FED-STD-595C-36375) and a mid blue-gray (FED-STD-595C-35237)—two of the colors employed on RAAF aircraft. Most of the testing reported here is for the light gray color 36375.
Polyisocyanates selected for this work included the hydrophilically modified aliphatic trimer types based on hexamethylene diisocyanate (HDI) such as Easaqua M 502 from Vencorex and Bayhydur 304 from Covestro. Component B formulations were made up by dispensing pre-dried organic solvents into screw-cap metal cans, which had been pre-dried in a warm oven. Weights were checked prior to adding the total quantity of water-dispersible polyisocyanate and then capped prior to mixing by gentle shaking of the cans. Component C is DI water.
Spray Application
Mixtures of the two parts were thinned with the minimum quantity of DI water needed to adjust spray application viscosity within the range of 30-40 s using a British Standard B4 viscosity cup, this being the most suitable range to achieve a balance between fluid flow from the spray gun and anti-sag capability on a vertical panel. The ready-to-spray (RTS) mixtures were filtered through a 190 micron fine mesh filter cone directly into the pot of the spray gun. Pre-primed panels were spray painted using a gravity-fed spray gun (1.4 mm nozzle) with pressure 30–35 psi adjusted for full fluid flow and a wide fan. Two coats of the topcoat were applied with a 10-min flash-off period in between, with the aim of achieving topcoat dry film thicknesses (DFTs) within the range 50 ± 10 µm. The coated panels were allowed to cure under ambient laboratory conditions [normally 20 ± 2°C and 35–65% relative humidity (RH)] for at least 14 days prior to testing.
Solvent-based Benchmarks
Solvent-based paint systems used for comparative purposes in most of the testing, including both anticorrosive primer and polyurethane topcoat, were obtained from three paint companies, referred to in this report as Companies A, B, and C. The primers and topcoats were mixed and applied according to the technical recommendations of the respective paint companies. The recommended primers used conformed to U.S. specification MIL-PRF-23377K.11 The topcoat paints were designated Topcoats A, B, and C and have been selected as examples representing the following characteristics:
Topcoat A: A “conventional solids” (CS) two-pack topcoat conforming to MIL-C-83286B with a measured VOC of 560 g/L
Topcoat B: An HS “standard durability” topcoat conforming to MIL-PRF-85285E, Class H, Type I
Topcoat C: An HS “extended weatherability” topcoat conforming to MIL-PRF-85285E, Class H, Type IV, described previously by Nickerson et al. as an “advanced performance topcoat” (APT).6
Testing
Testing was undertaken primarily in accordance with the requirements of MIL-PRF-85285E1 and the test methods therein. Testing used industry-standard equipment and methods. Adhesion testing was conducted using the cross-cut tape procedure, Method B, in ASTM D 3359.12 Some tests were specific to an Australian Defence Standard specification, DEF(AUST) 9001A, including tests for rate of dry.13 The substrate used for most tests was 1.2 mm thick aircraft aluminum alloy Al 2024-T3-Clad and was pretreated with Alodine 1200L prior to priming and topcoating. Al 2024-0-Clad, 0.5 mm thick, was used for reverse impact flexibility testing and 0.3 mm tinplate for mandrel bend testing. These flexibility tests are generally performed to determine the degree of flexibility of the topcoat and so do not require pretreatment or priming.
Panels prepared for testing the waterborne topcoat used MIL-PRF-23377K primer from Company A. Tests for topcoat flexibility were done without a primer as specified. Plain aluminum panels were used for some testing where the effect of substrate was considered to be negligible, particularly topcoat color, gloss, and durability.
An additional requirement for qualification as a Class W coating in the MIL-PRF-85285E specification is for the two components of the waterborne kit to pass all the specification requirements after being subjected to five cycles of freezing and thawing. Each cycle consists of a period of 16 h at –9 °C followed by a period of 8 h at room temperature.
The waterborne coating was tested and compared with Topcoat A to determine if there were any adverse effects on anticorrosive performance. The recommended anticorrosive primer from Company A was used as the primer for both topcoats in the salt spray and filiform corrosion tests, following the procedure in MIL-PRF-23377K.11 Al 2024-T3-Clad was used as the substrate and the test panels were pretreated with Alodine 1200. Salt-spray corrosion testing was performed in accordance with ASTM B117.14 Panels that were scribed with two intersecting lines, exposing the bare substrate, were placed in a 5% salt-spray cabinet for 2,000 h and then examined for blistering and corrosion products in the scribes. Filiform corrosion on similarly scribed panels was initiated by exposing the panels to an atmosphere of hydrochloric acid fumes for 1 h in a dessicator containing 12N hydrochloric acid and then transferring the panels to a humidity cabinet maintained at 40 °C and 80% RH for 1,000 h. The panels were then examined by measuring the distances of filamentary corrosion extending out from the scribes.
Gloss and Color Measurements
Gloss measurements of the topcoats were made at 20°, 60°, and 85° angles using an Elcometer 407 glossmeter. Color measurements in CIELAB 1976 color space, L*, a* and b*, were performed with a Minolta 2500d spectrophotometer using daylight illuminant D65 and 10° standard observer with the specular component included. Total color differences ΔEab* were calculated from the differences in the component color coordinates using equation (1).15
(1) ![]() Exterior Weathering
Exterior Weathering
Exterior durability testing was undertaken by measuring panels exposed at the DST Group Paint Exposure Test Facility at the Army Proving Ground at Monegeetta in central Victoria (latitude 37° 24’ S) and also at the Allunga Exposure Laboratory near Townsville in Queensland (latitude 19° 20’ S).16 Exposure angles at Monegeetta were adjusted to 20° facing north during the warmer months of the year (October to April) and to 55° facing north during winter. Exposure angles at Allunga were set to 5° facing north all year.
Quarterly measurements of gloss and color were made on unwashed (uw) and wet-wiped (ww) sides of each panel. The ww sides were prepared by gently wiping the prewetted surface with folded paper towels that had been soaked with water. Moderate pressure was applied to remove any deposited soil and loose chalking, and the panels were then allowed to drain and dry on a panel rack overnight. Figure 2 shows an example of an exterior test panel that has been exposed at Monegeetta for five years. The coating is a Type I topcoat from Company B. The extensive chalking that develops is readily apparent on the uw side of the panel.
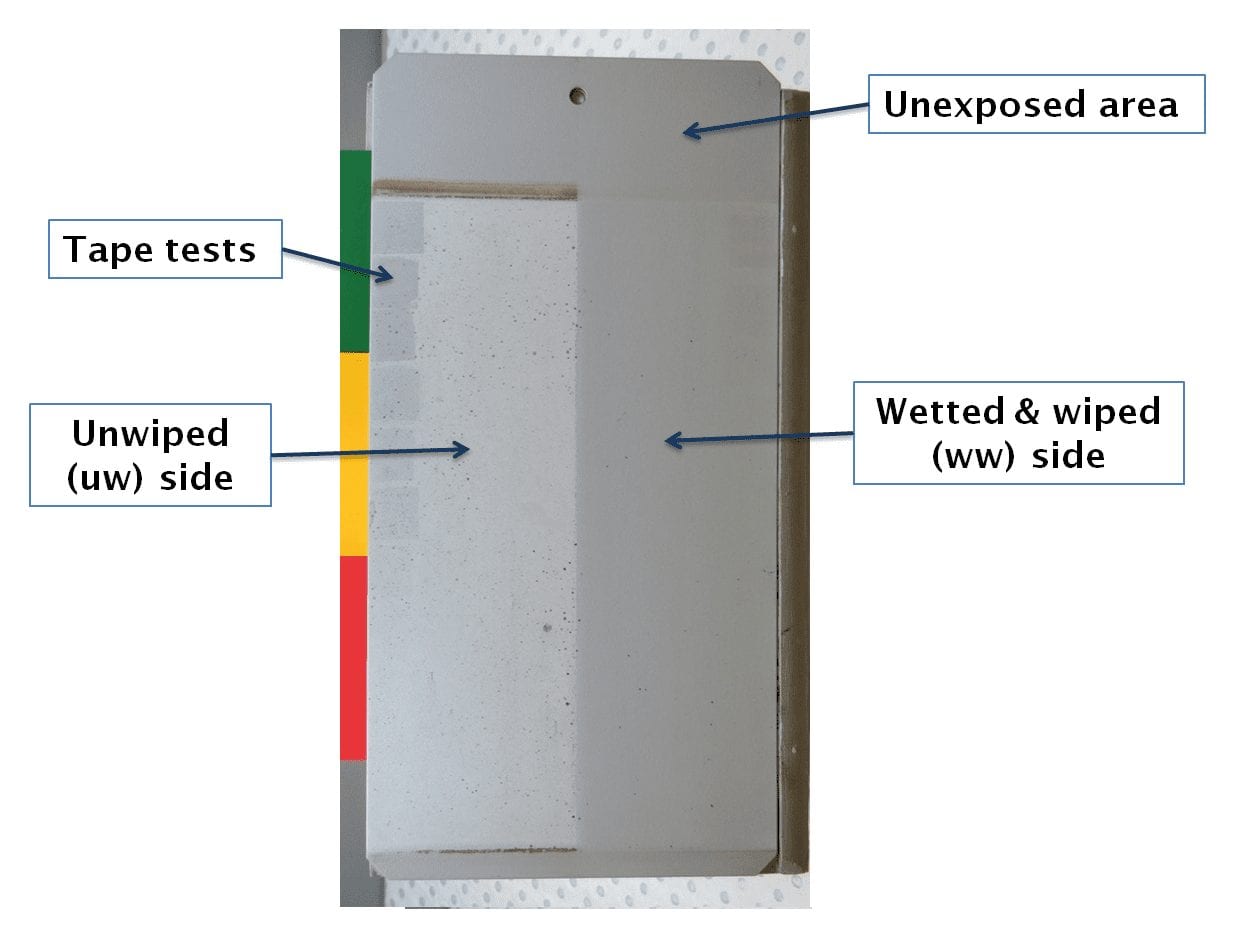
Figure 2—An exterior test panel, coated with a light gray 36375 Type I topcoat from Company B, after a period of five years at Monegeetta, showing the extensive degree of chalking that develops on the uw side of the panel.
The degree of chalking was determined by the tape test performed on the uw sides of panels.17 For the light gray 36375 colored topcoats reported here, a good quantitative measure of chalking was calculated from the L* values on the ww and uw sides of panels using equation (2).
(2) 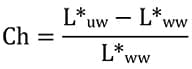 Calculations of VOC Levels
Method A
The VOC level for the waterborne topcoat, based on the total RTS mixture, was calculated from the formulation. The first method of calculation defines the total VOC content (g/L), including exempt VOC, of one liter of RTS mixture [equation (3)].
(3) 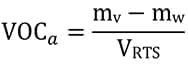 where mv and mw are the masses of the total volatiles (including water) and of the water only respectively, and VRTS is the volume of the RTS mixture.
Method B
The VOC level calculated according to various regulatory procedures requires removal of water and exempt VOCs from both numerator and denominator according to equation (4) as per ASTM D 3960.18
(4) 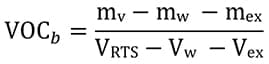 where mex is the mass of exempt volatile compounds, and Vw and Vex are the volumes of water and exempt volatile compounds, respectively.
For solvent-based products (mw = 0) that do not contain exempt volatile compounds, the VOCs obtained from equations (3) and (4) are identical. Information on the presence and wt% of individual exempt volatile compounds was obtained, where possible, from material safety data sheets for the individual components of the topcoat kits.
Method C
VOC levels (g/L) of the solvent-based topcoats were determined from measurements of solids (wt%) and density ρRTS (g cm-3) of the RTS mixtures using equation (5).
(5) ![]() Results from these measurements were interpreted as being equal to VOCa by equation (3), with mw = 0.
Results from these measurements were interpreted as being equal to VOCa by equation (3), with mw = 0.
Emissions per unit area of paint film
VOCs emitted from an RTS paint mixture were calculated as organic compound emissions (OCE) from a specified area of final paint film (gm-2) at a specified DFT (µm) using equation (6).
(6) 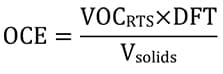 where VOCRTS is the VOC content in grams of one liter of RTS mixture, DFT is the dry film thickness of the applied coating (µm), and Vsolids is the volume occupied by the solids content of one liter of the RTS mixture (cm3). This gives the organic emissions from 1 m2 of paint film at the specified DFT and ignores emissions arising from overspray due to reduced transfer efficiency in spray application. The calculation may exclude exempt volatile compounds.
In some cases, density of the solids content could be obtained from paint manufacturers to enable calculations of Vsolids from the measured wt%. In other cases, estimates of the total volume of volatiles in the RTS mixtures were made from wt% data given in material safety data sheets and the densities for individual volatile compounds, then subtracting from the total RTS volume.
RESULTS
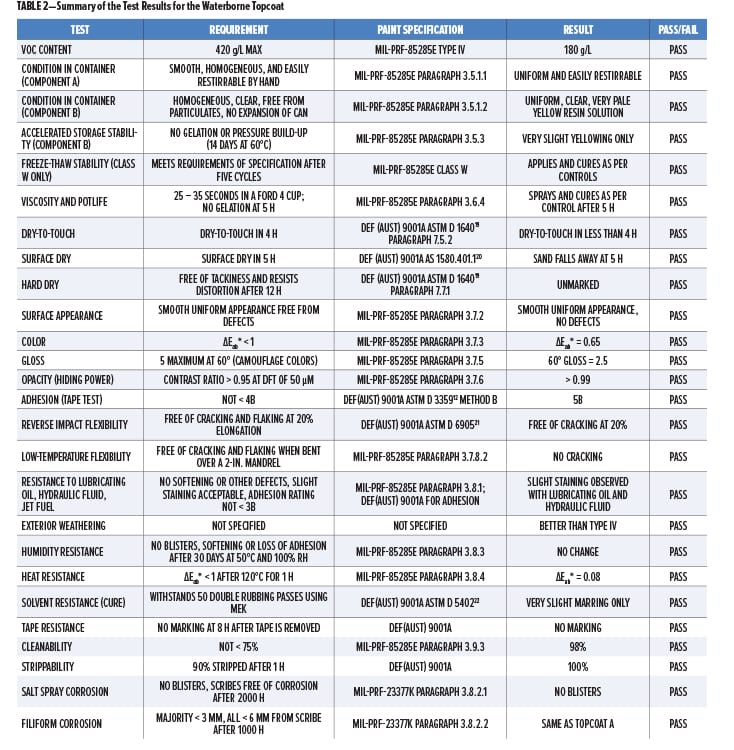
A summary of the results from testing the waterborne topcoat is presented in Table 2, which shows the tests undertaken, the requirements, and results, and the particular paint specifications for which the testing requirements were referred to. The individual test results, including comparisons with the solvent-based topcoats, are itemized and presented in more detail in the following.
In-can Properties
Component A: The waterborne Component A was examined after storing for 14 days without agitation. When the can was opened, the product displayed a small amount of syneresis; however, the product could be easily stirred by hand with a spatula to a smooth, homogeneous, and pourable composition. The coating was free of grit and displayed a smooth finish on the Hegman gauge.
Component B: Component B was a homogeneous, clear, very pale yellow liquid.
Accelerated Storage Stability
When stored at 57°C for 24 h, as per MIL-85285D,4 Component B displayed no gassing or pressure build-up, and there was no evidence of gelling or clouding. Storage stability testing in MIL-85285E requires both components to be stored at 60°C for 14 days. In this testing, Component B showed slight yellowing. Syneresis was evident in Component A and a thin layer of soft settlement was evident on the bottom of the can. After stirring to a uniform consistency with a spatula for 30 sec, the two components could be mixed and sprayed over a primed surface to give a coating that cured to produce a uniform, smooth paint film free of defects and with the same overall surface appearance as the control samples.
Mixing
Components A and B could be easily mixed by hand stirring with a spatula to a uniform consistency. The mixture was thinned with the minimum quantity of DI water needed to adjust the spray viscosity to 30–40 sec as determined by a British Standard B4 viscosity cup. Some care was needed to prevent the formation of bits during stirring, possibly due to some shocking out of the pigments or flatting agents on adding the Component B to Component A. Initial thinning of Component A with a portion of the DI water and continuous stirring by hand while adding the Component B prevented bit formation.
Spray Application
The mixed waterborne topcoat could be applied to primed surfaces by spray application, and dried and cured under ambient laboratory conditions to produce paint films with a uniform, smooth surface, free from a range of defects often characteristic of waterborne coatings, such as craters, fisheyes, and orange peel.
Potlife
A waterborne RTS mixture that had been made up and allowed to stand under ambient laboratory conditions for 5 h was spray applied and compared with a freshly made up RTS mixture. Both samples produced coating films that flashed off and dried at the same rate, cured to form films with the same smooth finish, appearance, and color, and had the same solvent resistance and adhesion properties
Freeze-thaw Stability
After being subjected to five freeze-thaw cycles, the two components of the waterborne coating remained stable. Component A displayed little signs of settling and could be restirred by hand to a uniform consistency. When mixed with Component B and thinned with DI water to spray viscosity, the coating could be spray applied over primed panels to form films that dried and cured to a smooth even finish free of defects and with unchanged color when compared with the control.
VOC Data
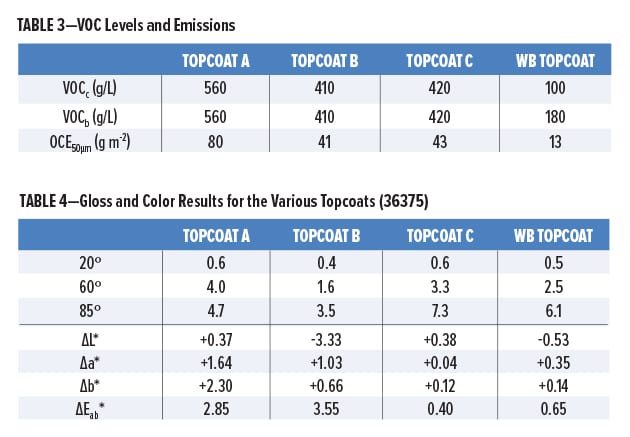
VOC data and emissions are presented in Table 3. The waterborne RTS composition contains a maximum of 100 g/L of organic volatiles. After removing the water and exempt volatiles from the calculation, as per equation (4), the waterborne mixture gives a VOC of 180 g/L. VOCs for the solvent-based topcoats were calculated from measurements of wt% and density using equation (5). As none of the topcoat mixtures A, B, or C contain exempt volatile compounds, the results corresponding to equations (3) and (4) are identical. Topcoat A gave a VOC of 560 g/L as expected for a CS topcoat, while the two HS topcoats gave VOCs conforming to the requirements of MIL-PRF-85285E for Types I and IV.
Figure 3 compares the organic compound emissions (OCE50μm) calculated using equation (6) from one square meter of dried paint film at a set DFT of 50 µm, showing that emissions from the waterborne topcoat are reduced by approximately 69% when compared with the two HS products.
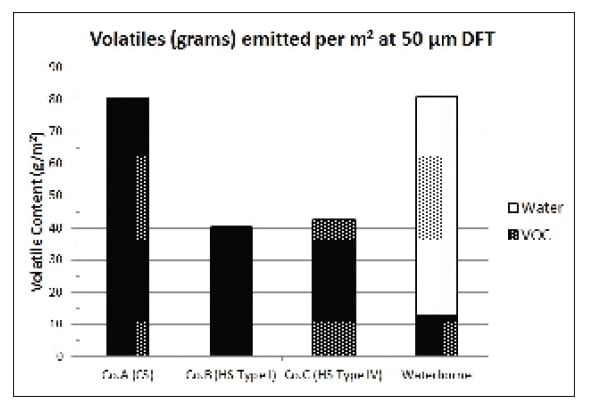
FIGURE 3—Total volatile emissions from 1 m2 of final paint film at 50 µm thickness.
Early Dry Properties
The spray-applied waterborne coating flashed off within 10 min, was set-to-touch in 1 h and dry-to-touch in less than 4 h when tested using the methods in ASTM D 1640.19 Both the waterborne topcoat and Topcoat A were print-free at 4 h whereas the HS Topcoats B and C remained tacky, and were noticeably slower to reach a print-free condition.
Surface Dry Condition
The surface dry condition test specified in DEF(AUST) 9001A requires that a small quantity of sand deposited on the coating, after 5 h under ambient laboratory conditions, will be easily removed with a fine brush. The waterborne coating and Topcoat A passed this test. Topcoat B just passed at 5 h, whereas Topcoat C failed.
Tape Resistance
After 12 h, the waterborne coating showed no evidence of any permanent marking, imprinting, or other visible defects caused by the masking tape. This contrasted with Topcoat C, which failed this test. Topcoat A passed easily, while Topcoat B passed marginally.
Hard-dry Condition
After 12 h, the waterborne coating was hard dry and showed no tackiness or any signs of distortion in the rotating thumb test. Topcoat A was also hard dry. Topcoat B was just acceptable, whereas Topcoat C remained tacky.
Cure
After seven days of cure, the waterborne coating withstood 25 double rubs using cotton wool soaked in methyl ethyl ketone (MEK) without rubbing through to the primer (as specified). In fact, the finish coating withstood 300 MEK double rubs with only very slight marring of the paint film being evident, as was also observed for the solvent-based coatings.
Opacity
The waterborne coating, formulated as the FED-STD-595 colors 36375 and 35237 gave contrast ratios > 0.99 (requirement: not < 0.95) at a DFT of 50 µm. The L* values measured over the black and white areas of the backing card were identical to each other within the uncertainties of the L* measurements of the coating color (± 0.03).
Surface Appearance
The waterborne coating dried to a uniform smooth surface free from runs, sags, bubbles, streaks, seeding, floating, mottling, and other defects. No orange peel was evident.
Color and Gloss
Gloss levels for the four topcoats (36375 only) and color differences with respect to the FED-595 color standard 36375 color chip are presented in Table 4. The requirements for camouflage topcoats are: 60° gloss < 5, 85° gloss < 10, and ΔEab* < 1. Topcoat C and the waterborne topcoat had very good color appearance with respect to the color standard. Topcoats A and B did not match the color standard particularly well, with color difference ΔEab* of 2.85 and 3.55, respectively. Topcoat B was also noticeably flatter in appearance than the other three topcoats, particularly at lower angles of viewing.
Dry Adhesion
Dry adhesion testing using the crosshatch test (ASTM D 3359, Method B) of the waterborne topcoat over the primer from Company A gave a rating of 5B (requirement: not < 4B). 12 Topcoats A, B, and C also gave adhesion ratings of 5B over their respective primers.
Water Resistance
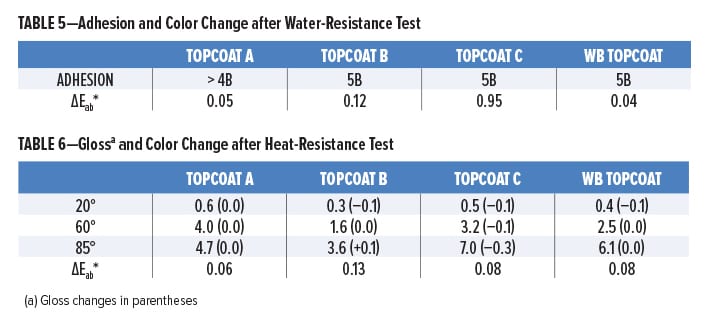
After immersion in water at 50°C for seven days in accord with DEF(AUST) 9001A, the waterborne topcoat over the primer from Company A gave an adhesion rating of 5B (ASTM D 3359). The waterborne coating retained excellent appearance and was free of blisters and other defects. The color difference ΔEab* between the immersed and un-immersed portions of the panel was less than 0.1. Table 5 presents a comparison with the solvent-based topcoats.
Humidity Resistance
The waterborne coating and the three solvent-based topcoats over their respective primers showed no signs of blistering, softening, water whitening, or other film defects.
Heat Resistance
Results from heat resistance testing (120°C for 1 h) are given in Table 6. There was no effect on gloss of the waterborne topcoat, and the color difference ΔEab* after the test was less than 0.1 (requirement < 1.0). The solvent-based topcoats performed equally well.
Reverse Impact Flexibility
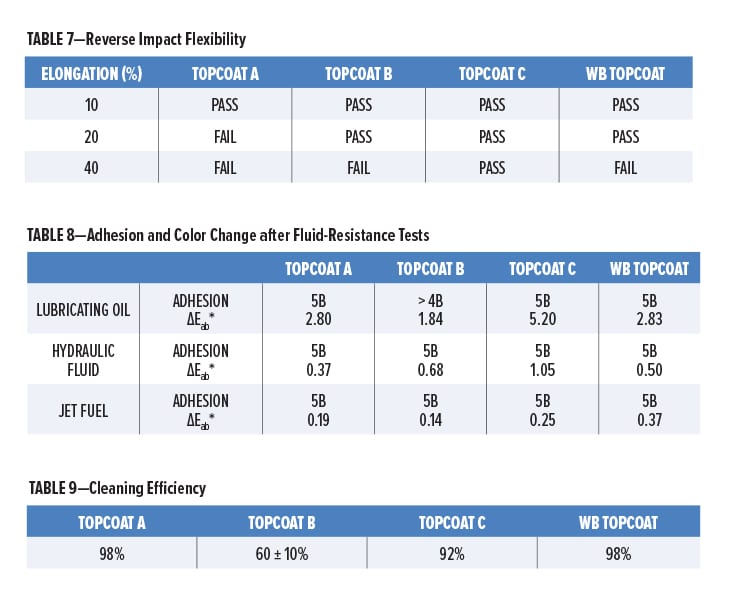
The waterborne coating, when tested over unprimed panels as specified, passed at 20% elongation, but just failed at 40% elongation as slight cracking was evident under 10X magnification. The MIL-PRF-85285E requirement is for a pass at 40% for Types I and IV coatings, whereas DEF(AUST) 9001A requires a pass at 20%. Topcoat A failed at 20% but passed at 10%. Topcoat B failed at 40% but passed at 20%. Topcoat C passed at 40%. These results are summarized in Table 7.
 Low-Temperature Flexibility
The waterborne coating exhibited no cracking when bent over a 2-in. mandrel at –51°C as specified for camouflage colors. The solvent-based coatings A, B, and C also resisted cracking.
Mandrel Bend
The waterborne coating and the solvent-based coatings A and C resisted cracking when bent over a 1/16-in. mandrel. Coating B cracked but remained intact over a 1/8-in. mandrel.
Fluid Resistance
The coatings were tested by immersing panels in lubricating oil at 120°C for 24 h, hydraulic fluid at 66°C for 24 h, and jet fuel at room temperature for seven days as specified in MIL-PRF-85285E. Results are presented in Table 8. In all cases, the waterborne coating showed no signs of blistering, softening, or other defects. The only other allowance is that “slight staining of the coating is acceptable.”
Crosshatch adhesion testing of the waterborne coating 1 h after removing the panels from the fluids gave adhesion ratings of 5B. Very little color change was evident with jet fuel (ΔEab* = 0.37) and hydraulic fluid (ΔEab* = 0.50). Some staining was noticeable with lubricating oil (ΔEab* = 2.83), but this was comparable with the degree of staining from the solvent-based Topcoats A and B. Topcoat C was noticeably affected by the lubricating oil, with ΔEab* = 5.20 and being visibly yellowed below the immersion line.
Cleanability
The waterborne coating gave a cleaning efficiency of 98% (requirement 75% for camouflage colors). This compared favorably with the old technology Topcoat A, while being significantly better than the HS topcoats (Table 9). A particularly poor result was obtained for Topcoat B, a result of 60% constituting a fail.
Corrosion Resistance: Salt Spray
The use of the waterborne coating over the primer from Company A had no significant adverse effect on the degree of corrosion when compared with the recommended Topcoat A over the same primer. When tested in accord with MIL-PRF-23377K,11 salt spray testing is required to show no blistering after 2000 h and the scribes must be free of corrosion products. The results of this testing showed no blisters with either topcoat after 2000 h. The scribes were free of corrosion products.
Corrosion Resistance: Filiform
The requirement for filiform corrosion testing is that the coating system should not exhibit filiform growth extending beyond 0.25 in. (~ 6 mm) from the scribe, and that the majority of the filaments shall be less than 0.125 in. (~ 3 mm) from the scribe after 1,000 h. As for salt spray, the priming system from Company A was used with both the waterborne topcoat and Topcoat A. Photographs of these two panels are shown in Figure 4. The degree of filiform corrosion growth out from the scribe was monitored for a period up to 3000 h and was found to be similar in both number density and length for both topcoats (Figure 5). All filamentary growth was < 3 mm from the scribe, a result associated with the performance of the priming system from Company A.
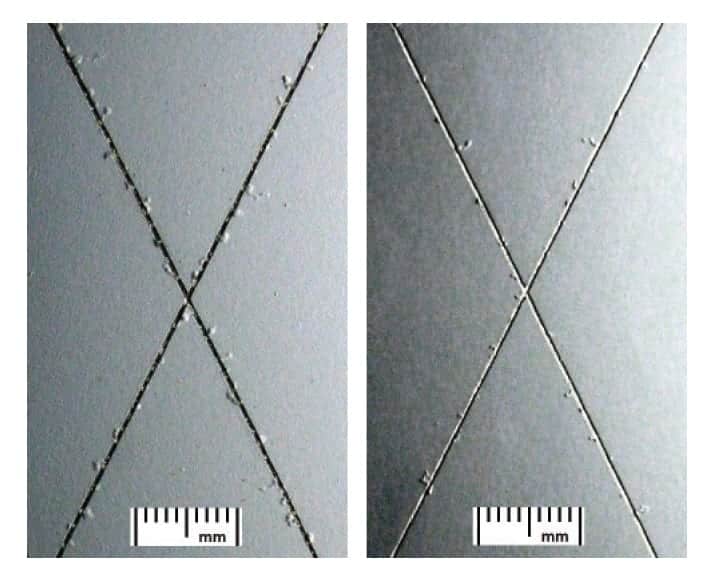
FIGURE 4—Photographs of filiform corrosion test panels of waterborne topcoat (right) compared with Topcoat A (left) over the priming system from Company A after 3000 h.
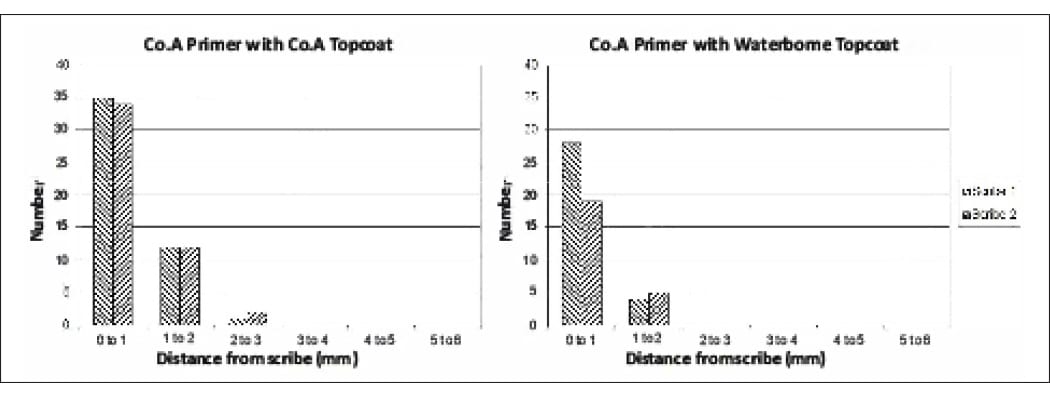
FIGURE 5—Distribution of filiform filament distances from scribes after 3000 h for waterborne topcoat compared with Topcoat A over the same priming system.
Exterior Durability
Results of exterior exposure testing have been evaluated in a number of different ways. In the work reported in this paper, specifically for the Federal Standard light gray color FED-STD-595-36375,8 it was found that the development of chalking was manifested primarily as an increase in lightness value L*. Loose chalk produced a whitish appearance that gave rise to a large increase in the L* value and removal by gently wiping under running water generally returned an L* value that was more closely aligned with the unexposed surface.
The results of color measurements (Figure 6) show significant changes on the uw sides of panels, whereas the ww sides showed very little change. Most of the total color change occurring on the uw sides was due to an increase in lightness value L* and could be attributed to the loose chalk that developed and was easily wiped away. The relative stability of color underneath the chalked layer shows that there was little inherent color change arising from the pigmentations used in each coating.
The extent of difference in performance of the various topcoats discussed in this article is perhaps best demonstrated by comparing the appearance of the best and worst examples after exterior exposure for several years. Figure 7 compares the appearances of Topcoat B and the waterborne topcoat after five years of exposure at Monegeetta. The Type I topcoat from Company B shows a high degree of fading on the unwiped side, which has been shown to be a result of chalking. The waterborne topcoat shows very little change after five years.
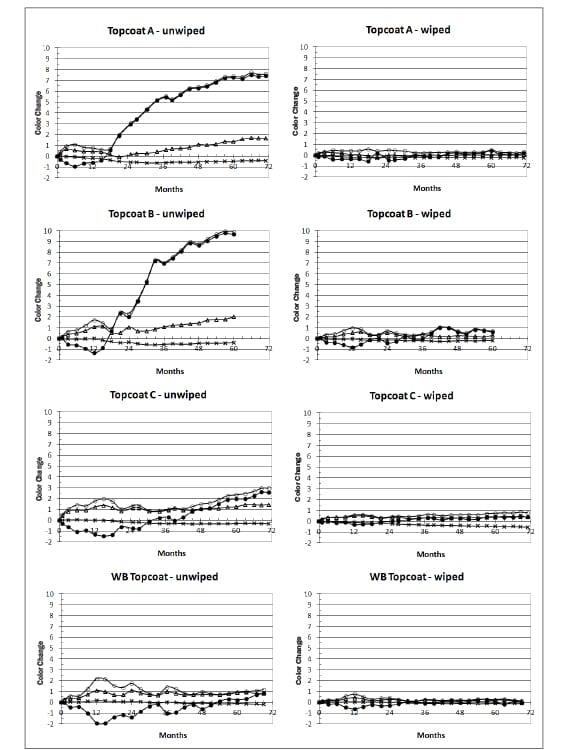
FIGURE 6—Color changes on wiped and unwiped sides of panels of the four topcoats during exposure testing at Monegeetta; ΔEab* (open circles), ΔL* (dots), Δa* (crosses), and Δb* (triangles).
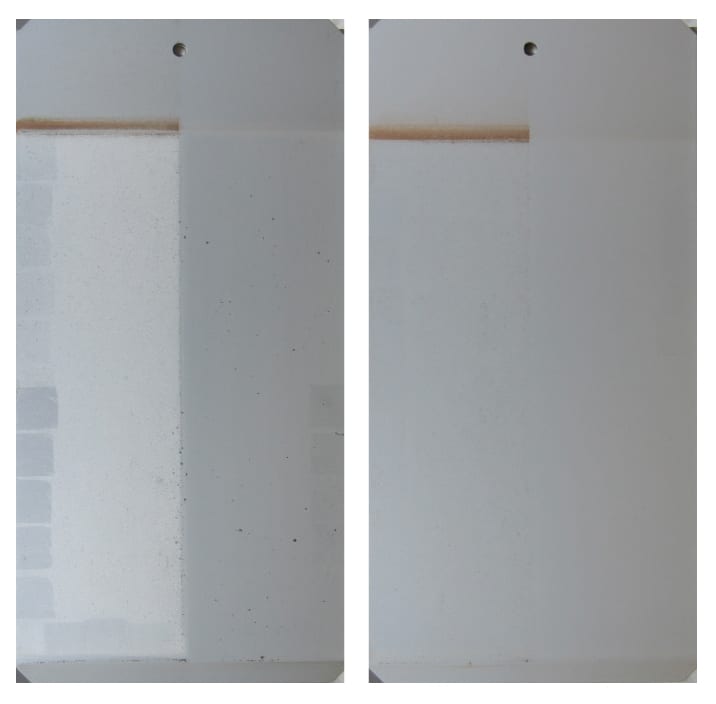
FIGURE 7—Photographs comparing the appearance of exposure panels of Topcoat B (left) with the waterborne topcoat (right) after five years at Monegeetta.
Gloss measurements could not be used successfully to determine the onset of chalking, primarily because of the effect of dirt pickup on gloss measurements of the unwiped sides of panels.
Results of chalking undertaken by the tape test at both Monegeetta and Allunga are shown in Figure 8. These results show that the development of chalking for each coating occurs at slightly faster rates at Allunga than at Monegeetta as expected, but the differences are not great.
For the particular color tested and reported in this article (FED-STD-595-36375), it was found that a most useful assessment of chalking could be determined by comparing the L* values on the uw sides of panels with the L* values on the ww sides. Differences in the L* values could therefore be used as a measure of extent of loose chalk development and usefully expressed as a fraction with respect to L*ww [equation (2)]. These results are shown in Figure 9. The curves are characterized by a slight initial decline in Ch value attributable to a small amount of dirt pickup on the unwashed sides of panels. As chalking begins to take place, Ch values begin to rise and a point is reached where the effects of dirt retention and chalking just balance each other (Ch = 0). If chalking develops at a rapid rate, its magnitude becomes much larger due to the small amount of dirt retention.
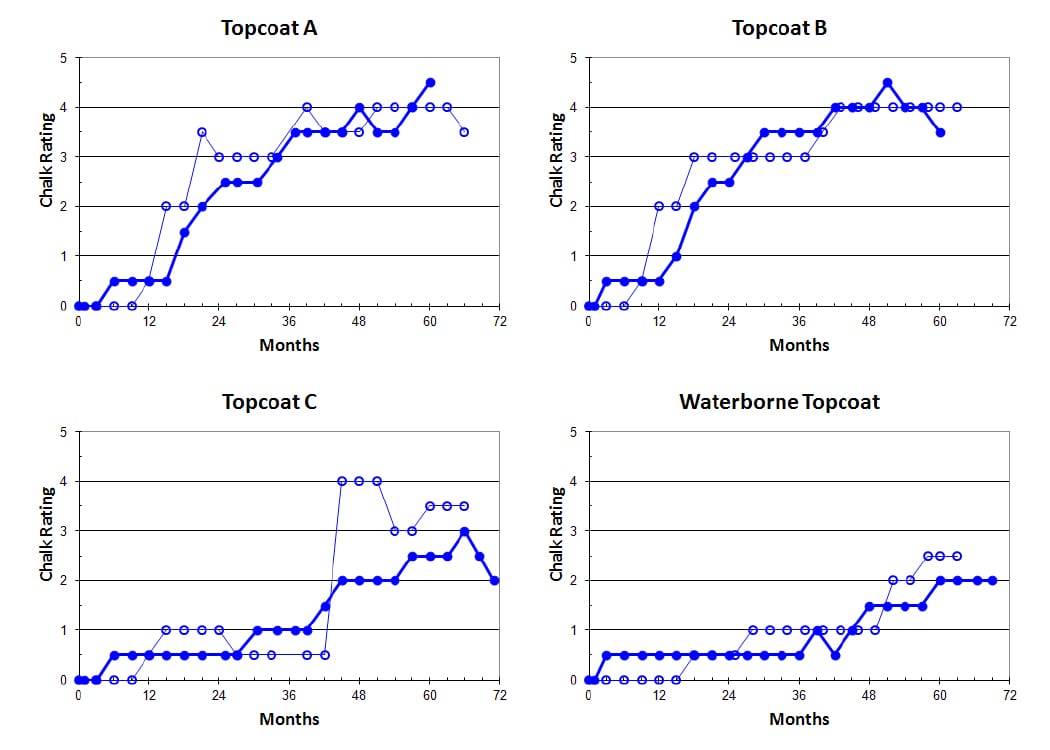
FIGURE 8—Development of chalking by the tape test of the four different topcoats during exterior exposure testing at Monegeetta (dots) and Allunga (open circles).
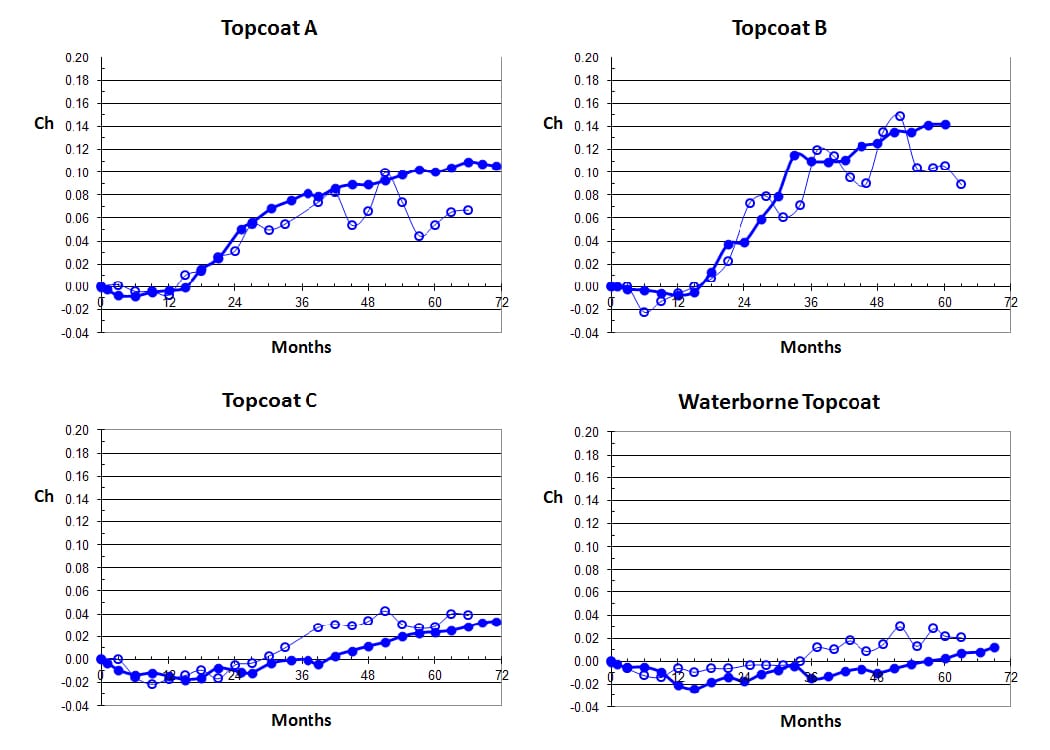
FIGURE 9—Development of chalking by equation (2) of the four different topcoats during exterior exposure testing at Monegeetta (dots) and Allunga (open circles).
In all of these results, Topcoat A shows a sudden rise in chalking from about 15 months, as evidenced by the sudden increase in Ch value, and the degree of chalking after five years is indicated by a Ch value of 0.10. Topcoat B (Type I) shows that a Type I HS topcoat is no better than a conventional solids topcoat. While rapid chalking development commences at about the same time (15 months), the severity of the chalking after five years is much more visible to the eye with a Ch value of 0.14.
Topcoat C, which is qualified as a Type IV coating, shows a significant improvement over the others, with noticeable chalking development not occurring until about three years—a much slower rate of chalking development taking place than for Topcoats A and B and a much-reduced degree of severity after five years (Ch = 0.02). The waterborne coating also shows excellent results, with only very slight indications of chalking. The curve shows a very slow rate of increase in Ch value and no evidence of sudden increase in Ch over a period of five years.
DISCUSSION
The results of this work have demonstrated the capability of a new waterborne two-pack polyurethane topcoat formulation as a finish coating for military aircraft paint systems. The coating can be spray applied using conventional spray equipment and techniques to produce paint films that wet out military aircraft primers without producing film defects such as craters, fisheyes, and blistering. The coating flashed off and dried at rates faster than HS products and comparable with old CS technology topcoats. The coating dried to produce cured films with a smooth uniform finish and excellent opacity, and can be formulated to the requisite low-gloss level. The films have excellent degree of cure, as determined by MEK double rubs, and excellent adhesion to a chromated, solvent-based primer. The in-service performance properties include excellent resistance to water immersion, very good cleanability, and the required chemical resistance to jet fuel, hydraulic fluid, and lubricating oil, while having flexibility properties comparable with the solvent-based topcoats.
Dry adhesion was determined by the crosshatch test (ASTM D 3359, Method B12) over different primers, including chromated solvent-based primers from Companies A and B, a chromated waterbased primer from Company C, and a chromate-free waterbased primer from Company D. In all cases, the waterborne topcoat gave adhesion ratings greater than 4B (requirement: not < 4B).
The impact flexibility requirement for a pass of 40% elongation in MIL-PRF-85285E was found to be difficult to meet. Inspection of the four sets of impact panels for the different topcoats showed a distinct failure of Topcoat B at 40%, with a layer of coating breaking cleanly away from the substrate, whereas the others appeared to pass at 40%. Topcoat A, however, showed some concentric circular crazing at 40%, and slight cracking was also observed at 20% by examining with 10-power magnification. Topcoat C passed at 40%. This trend in improved flexibility in going from Topcoat A to B and then to C appears to be consistent with the observed downturn in chemical resistance properties and slower speed of dry of these three topcoats. Topcoat A, representing the old CS technology, dried and cured much faster than the two HS products and gave the best chemical resistance properties, so it might be expected to have the lowest flexibility, which it does (10%).
The HS products, starting off with Component A polymers, which are likely to be either lower molecular weight or lower glass transition temperature polymers than for Topcoat A, might be expected to produce more flexible films, but at the expense of speed of dry and chemical resistance. This correlates with the observation that Topcoat C gave very slow dry rate and the poorest chemical resistance results (Tables 5 and 8). In recognition of the observation that coatings with better flexibility are more likely to dry slower and have lower chemical resistance properties, the DEF(AUST) 9001A standard reduces the requirement for reverse impact flexibility to a pass at 20% elongation, which the waterborne topcoat meets. It was possible to reformulate the waterborne topcoat to be more flexible with passes at 40% and higher, but this led to poorer chemical resistance properties.
An examination of the safety data sheets for the solvent-based topcoats used in this study revealed that none of them used exempt solvents, hence VOCs calculated by equations (3) and (4) are the same (Table 3). The VOCb value calculated for the waterborne topcoat is disadvantaged by the removal of water from both the numerator and denominator of the calculation [equation (4)]. Figure 3 produces a more useful comparison that shows the significant reduction in real organic compound emissions from a given area of paint film at a constant final thickness. At 50 µm DFT, the waterborne topcoat emits only 13 g of organic volatiles per square meter, in contrast to 41 g and 43 g from the HS products and 80 g from the CS topcoat. From a practical viewpoint, these calculations assume 100% transfer efficiency from the spray gun.
A number of approaches for reducing emissions of the current waterborne topcoat even further are currently being investigated. The OCE value of 13 gm-2 reported above contains about 5 g of a solvent, N-methyl pyrrolidinone, present in the PUD latex as a result of the manufacturing process used to make it. By using an alternative latex that does not contain this solvent, it would be possible to reduce the emissions to 8 gm-2. Furthermore, substituting the solvent used in Component B with an exempt volatile compound such as t-butyl acetate would enable the VOC calculated by equation (4) to be reduced to approximately 40 g/L.
The waterborne topcoat exhibits excellent resistance to exterior weathering when compared with the solvent-based products. The graphs in Figures 8 and 9 show that the Type I HS product from Company B, while offering the advantage of lower VOC and higher solids, has poorer durability as judged by the degree of chalking that develops. Topcoat B begins to develop chalking at about 15 months as does Topcoat A, but after five years, the degree of chalking is about 40% greater. The Type IV HS product from Company C shows much better results, with onset of chalking not taking place until about three years and, when developing, takes place at a slower rate than Topcoats A and B. The waterborne topcoat, however, has given by far the best results, showing very little sign of chalking after five years with a very slow rate of development.
Although the different products had measurably different color to start with, it is not expected that these differences would have significant impact on the other properties measured in this work. The minor adjustments needed to obtain good color matches are not expected to change the results from working properties such as chemical resistance, flexibility, adhesion to primer, or exterior chalking.
The differences between the chalking development curves for Monegeetta and Allunga are not particularly great. It was expected that exposure under the harsher conditions of tropical Queensland would produce significantly greater chalking rates and that the extent of chalking, as monitored by the Ch values calculated, might have been greater than those from Victoria. For each product, the time of onset of rapid chalking development and the extent of chalking in each case was about the same for the two sites. These results probably indicate that the weather and sunlight exposure conditions are more or less equally severe across the whole of Australia from the point of view of weathering.
One of the major issues for the RAAF is the effect of the severe climate conditions in Australia. There is a major emphasis to ensure that topcoat coatings that are not durable enough will not be accepted for use. None of the other results required by MIL-PRF-85285E testing is worthwhile if a product does not have good exterior performance. It is for this reason that the current study has ignored laboratory weather testing in favor of exterior exposure testing for several years. These studies are ongoing7 and will include verification of the latest waterborne topcoat coatings against the best performing Type IV topcoats.
In the present study, a waterborne topcoat technology has been formulated that demonstrates excellent resistance to chalking in exterior exposure testing, and when underway after several years, the rate and extent of chalking development is only minor compared with the solvent-based topcoats. In addition to this, it has been shown that the waterborne topcoat is capable of being formulated to the performance test requirements of MIL-PRF-85285E for military aircraft.
Some of the earlier waterborne prototypes in this work had very short potlives with respect to viscosity rise, resulting in gel times of less than one hour. The development work has established formulations for RTS mixtures that show no viscosity rise for many hours, and which maintain a sprayable consistency all day. For these types of formulations, potlife may potentially be governed more by the deterioration in working properties of the spray-applied coating as the RTS mixture ages. Checks on film properties of samples made up at different times, including drying rate, film appearance, gloss level, cure, and adhesion gave results unaffected by standing time after being made up RTS for up to five hours. The advantage of this is that a single mixture could be made up at the beginning of a working day without the need to remake several times throughout the day.
Although it is expected that corrosion performance would depend primarily on the pretreatment and primer layers of the paint system, it should be ensured that any change to a different topcoat does not compromise anticorrosive performance. Studies of the effect of the waterborne topcoat on corrosion are illustrated by the filiform results in Figures 4 and 5, showing that the extent of filiform filament growth is not greatly affected when compared with the recommended solvent-based topcoat. Further studies need to be undertaken to verify whether there is a significant difference or if there might be any benefit in using the waterborne topcoat.
The waterborne topcoat has been tested via spray application for wetting out and laydown properties over a number of different primers. In all cases, good application properties were observed, with the waterborne topcoat drying to form defect-free paint films with the same smooth finish and good adhesion to primer.
Ultimately, an important goal of this work is to offer the waterborne topcoat as part of a total water-based paint system that includes a waterborne chromate-free primer. This will require significant further work, particularly to obtain corrosion performance equal to the chromated paint systems.
CONCLUSION
A two-pack waterborne topcoat formulation has been developed that demonstrates the suitability of this technology for air force applications. This technology offers significantly reduced VOC emissions when compared with commercial HS solvent-based products. The waterborne topcoat exhibited excellent exterior durability performance under the harsh climatic conditions of Australia. After five years in Queensland, it exhibited very little chalking or color change. Tests showed that the waterborne topcoat passes all the requirements listed in Table 2 and can potentially be qualified as a Class W, Type IV topcoat in the MIL-PRF-85285E specification.
References
1. MIL-PRF-85285E, Performance Specification. Coating: Polyurethane, Aircraft and Support Equipment, 12 January, 2012.
2. MIL-C-83286B (USAF), Military Specification. Coating, Urethane, Aliphatic Isocyanate, for Aerospace Applications, 5 October, 1973.
3. RAAF Specification Engineering K62, Aircraft Finishing Systems–Epoxy/Polyurethane, Issue No.3, 2 April, 1982.
4. MIL-PRF-85285D, Performance Specification. Coating: Polyurethane, Aircraft and Support Equipment, 28 June, 2002.
5. MIL-PRF-85285D, Amendment 3, Performance Specification. Coating: Polyurethane, Aircraft and Support Equipment, 2 February, 2009.
6. Nickerson, W., Mera, A., and Lipnickas, E., Performance Comparison of Modified MIL-PRF-85285 Topcoats (Advanced Performance Topcoats), NAVAIR Public Release 09-775, 22 May, 2010; also presented at NACE 2009, Corrosion Paper #7997.
7. Clayton, T.P. and Danek, S.K., Environmental Durability of RAAF Topcoats Qualified to MIL-PRF-85285, ACW-2014 Aerospace Coatings Workshop, DSTO-Melbourne, 31 October, 2014.
8. MIL-STD-595C, Federal Standard. Colors Used in Government Procurement, 16 January, 2008.
9. MIL-STD-595A, Federal Standard. Colors Used in Government Procurement, 2 January, 1968.
10. QPL-85285 for MIL-PRF-85285E, Coating: Polyurethane, Aircraft and Support Equipment, 19 August, 2016.
11. MIL-PRF-23377K, Performance Specification. Primer Coatings: Epoxy, High-Solids, 7 June, 2012.
12. ASTM D 3359–97, Standard Test Methods for Measuring Adhesion by Tape Test, 1998.
13. DEF(AUST) 9001A, ADF Aircraft Epoxy/Polyurethane Paint Coating System, 5 June, 2009.
14. ASTM B 117–03, Standard Practice for Operating Salt Spray (Fog) Apparatus, 2003.
15. ASTM D 2244–93, Standard Test Method for Calculation of Color Differences from Instrumentally Measured Color Coordinates, 1993.
16. AS/NZS 1580.457.1, Paints and related materials–Methods of test. Resistance to natural weathering, 1996.
17. ISO 4628-6: 2011(E), Paints and varnishes–Evaluation of degradation of coatings–Designation of quantity and size of defects and of intensity of uniform changes in appearance–Part 6: Assessment of degree of chalking by tape method, 15 August, 2011.
18. ASTM D 3960–98, Standard Practice for Determining Volatile Organic Compound (VOC) Content of Paints and Related Coatings, 1999.
19. ASTM D 1640–95, Standard Test Methods for Drying, Curing, or Film Formation of Organic Coatings at Room Temperature, 1999.
20. AS/NZS 1580.401.1, Paints and related materials–Methods of test. Surface dry condition, 1999.
21. ASTM D 6905–03, Standard Test Method for Impact Flexibility of Organic Coatings, 2004.
22. ASTM D 5402–93, Standard Practice for Assessing the Solvent Resistance of Organic Coatings Using Solvent Rubs, 1993.
This paper was awarded Honorable Mention at the 44th International Waterborne, High-Solids and Powder Coatings Symposium, February 22-24, 2017, in New Orleans, LA.
CoatingsTech | Vol. 14, No. 6 | June 2017