
By George R. Pilcher, The ChemQuest Group Inc.
Writing in these pages in 2015,* I stated that “The years between 2014 and 2019 will be good ones,” and so they have been—but “good” is a relative term, at least in the context of economic health. In June 2009, the Great Recession, which had lasted for 18 months and caused American households to lose $16 trillion in net worth, was officially declared to be at an end. It is now almost exactly nine years since the official ending of the most financially devastating and emotionally traumatic economic downturn since the Great Depression. During the 110 months since the ending of the Great Recession, the United States has experienced the second-longest post-war recovery, and ChemQuest predicts that 11 months from now, in July 2019, it will become the longest post-recession recovery in modern world history.
To acknowledge that the current recovery is likely to be the longest in modern history is not, however, the same thing as saying that it is also the strongest, because it has not been—not by a long shot. At just a tad over 21%, real GDP expansion during the nine years following the end of the Great Recession pales when compared to the 39% real GDP expansion during the post-recession period in the 1980s and 43% following the recession in the 1990s.
With an average GDP growth of only 2.1% annually, this has frequently not even felt like a recovery—even now, with the United States for all practical purposes at full employment, we only experienced modest GDP growth of 2.3% in 2017, up from 1.6% in 2016. The outlook for 2018 is better, but still modest by historical post-recession standards: Kiplinger and several other pedigreed prognosticators of future financial matters are predicting real GDP to grow at a rate of 2.9% during 2018, a prediction that feels a bit optimistic, in the light of Q1 and Q2 results, but is nonetheless still within the perimeter of the ballpark. It is within the context of the current overall economic situation that we now turn to the U.S. coatings industry performance during 2017 and its anticipated performance during the remainder of 2018 and into 2019. . . .
2018 will be a strong year for paint and coatings in the United States, the decline in automotive OEM being compensated for by strengthening in residential, commercial, and industrial construction. Coatings producers will not be without their challenges—titanium dioxide continues to evince grimaces of pain among paint makers as prices continue to increase, and there will continue to be periodic shortages, due largely to tighter inventory controls by raw material suppliers.
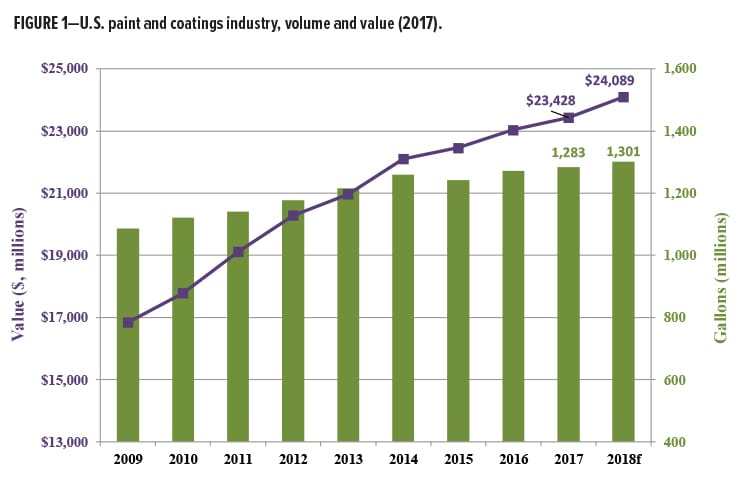
Nonetheless, 2017 finished with a respectable production of 1.28 billion gallons valued at $23.4 billion (Figures 1–3).
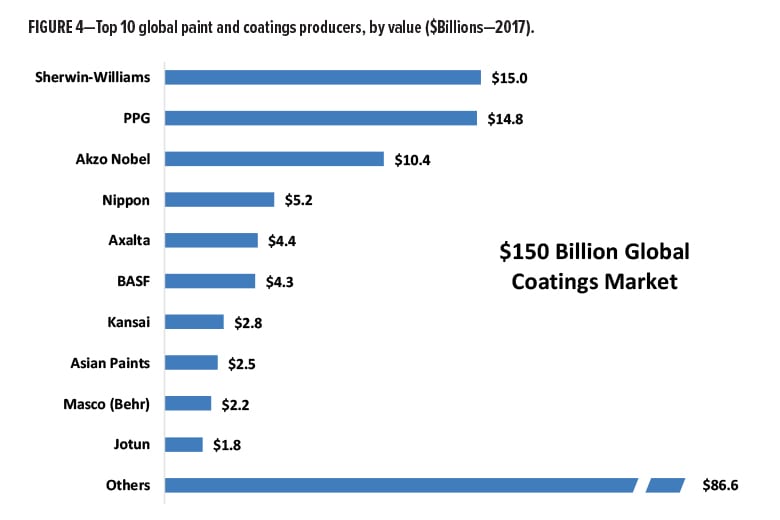
 Globally, consolidation continues to be a key theme, and the United States has seen particularly vigorous activity in this area: with Sherwin-Williams’ acquisition of Valspar, the top three global coatings firms account for 63.4% of the top 10 global coatings firms’ sales, up from 48% in 2005 (Figure 4). Overall, the tone remains upbeat for the major coatings producers, and—as long as the recovery continues its steady (albeit slower than most companies would wish) upward trajectory—things look pretty good for the regional producers, as well.
Why do things look so good for 2018 and beyond? From a macroeconomic point of view, since the turn of the millennium, coatings have shown relatively steady growth of about 2+%. The paints and coatings industry is generally divided into three market segments:
- Architectural (aka: decorative)
- Industrial OEM
- Special Purpose
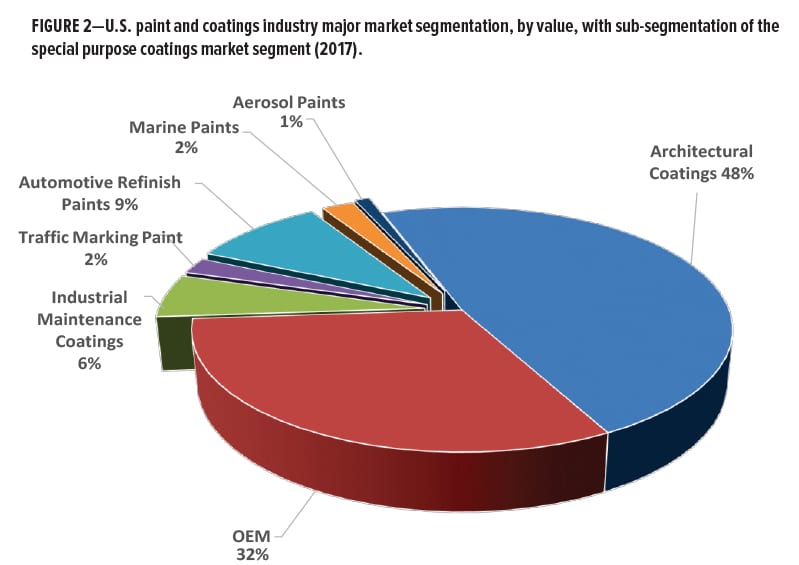
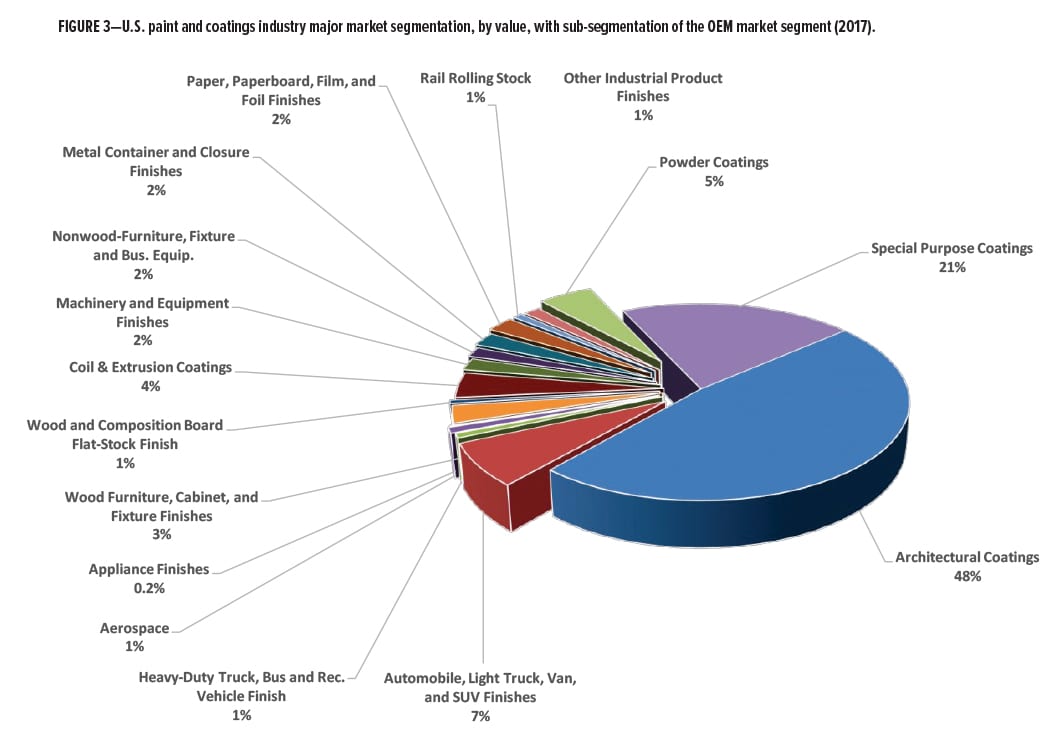
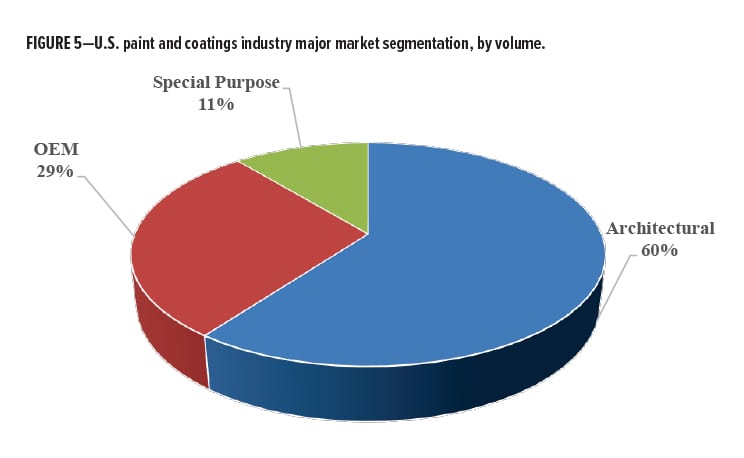
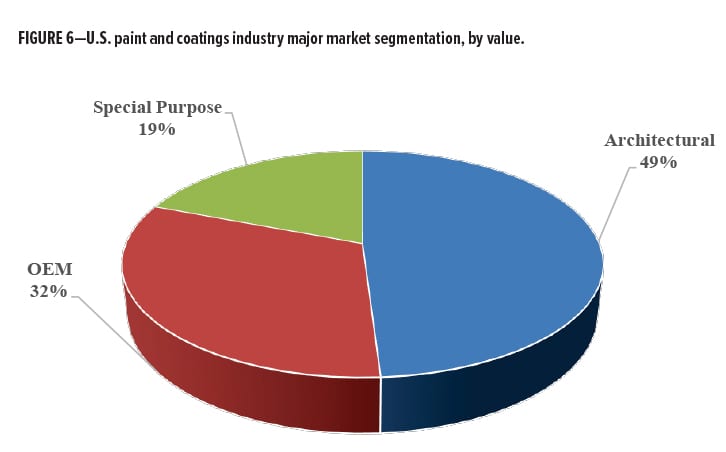
The architectural coatings segment began recovering in late 2014/early 2015, and this was good news, since this segment currently accounts for 60% of the volume, and 48% of the value, within the coatings industry. The other two major segments of the U.S. coatings industry—industrial OEM and special purpose coatings—account for 29% and 11%, respectively, of the volume and 32% and 19%, respectively, of the value. (See Figures 5 and 6 with respect to the relative volume and value of these three major paint and coatings segments.)
 In the United States, architectural coatings sales are highly correlated with the health of the housing/construction market. Industrial OEM coatings benefit from a pickup in industrial production, while special purpose coatings tend to track with automotive sales, accident rate, the size of the car parc (total number of registered vehicles in use at any given time), and total miles driven (refinish paints)—and construction and the price of crude oil (industrial maintenance coatings).
Special purpose should outpace the other two segments in 2018, however, because the headwinds that negatively affected the special purpose segment during 2015–2016, as a result of weak activity in oil and natural gas, are abating as global crude oil has risen to the low-mid $70s per drum and natural gas demand is increasing. While stronger crude oil prices have a disproportionately positive effect on special purpose coatings, particularly with regard to industrial maintenance (I/M) coatings, they typically provide a raw material headwind for all three coatings segments, and we are seeing signs of raw material increases, with an overall increase of 4–6% anticipated in all areas of paints and coatings in 2018.
Architectural
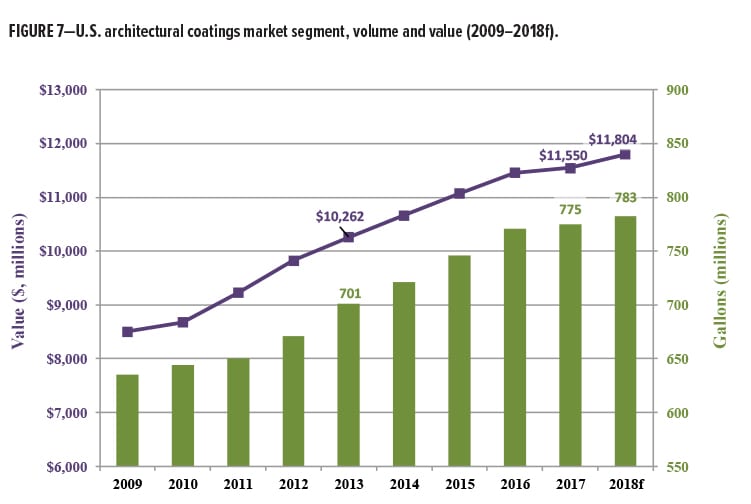
Architectural coatings grew 0.8% in 2017, with volume growth of 0.6% and pricing gains of 0.2%. Sales are forecast to rise 2.2% in 2018, based on an anticipated volume growth of 1.0% and an increase in selling price of 1.2%, resulting in volume of 783MM gallons valued at $11.8Bn. (see Figure 7.) It is reasonable to anticipate margin improvements throughout the entire value chain, since approximately 50% of raw material purchases are tied to oil, whether one or multiple chains away. Another 28% is tied to titanium dioxide pigments, which increased in Q1–Q2 of 2018, and appears to be seeking an “angle of repose,” with many industry observers anticipating prices to stabilize as the year marches toward its end. Paint producers already either have, or will be, raising prices during 2018 to improve margins hurt by raw material price increases in 2017 and early 2018, and to keep margins in line with expectations.
Not a lot has changed with regard to regulatory trends, insofar as most manufacturers of architectural coatings have formulated ultra-low VOC (<10g/l) interior paints, and are either selling them or have them “at the ready” in case there is either a regulatory need or increased consumer pull. There has been considerable speculation that there will be a potential shift toward lower volatile organic compound (VOC) formulations for interior paints, with California considering lowering the threshold of content allowed to 25 g/l. While we do not expect to see this happen, if it should take this route without allowing exceptions, then it is likely that the response from paint companies will be a shift to ultra-low VOC coatings (≤10 g/l), rather than to 25 g/l. The logic in doing so would be that California will eventually lower the level from 25 g/l, and there is little to be gained from the time and effort necessary to reformulate multiple product lines twice, rather than once. If, however, SCAQMD should lower the VOC limit to 25 g/l, but allow the current “low VOC” (<50 g/l) paints to continue to be sold in return for maintaining the current “AIM Fee Rule” (Rule 314), then it is likely that the industry will continue into the foreseeable future with a mixture of low VOC and ultra-low VOC coatings.
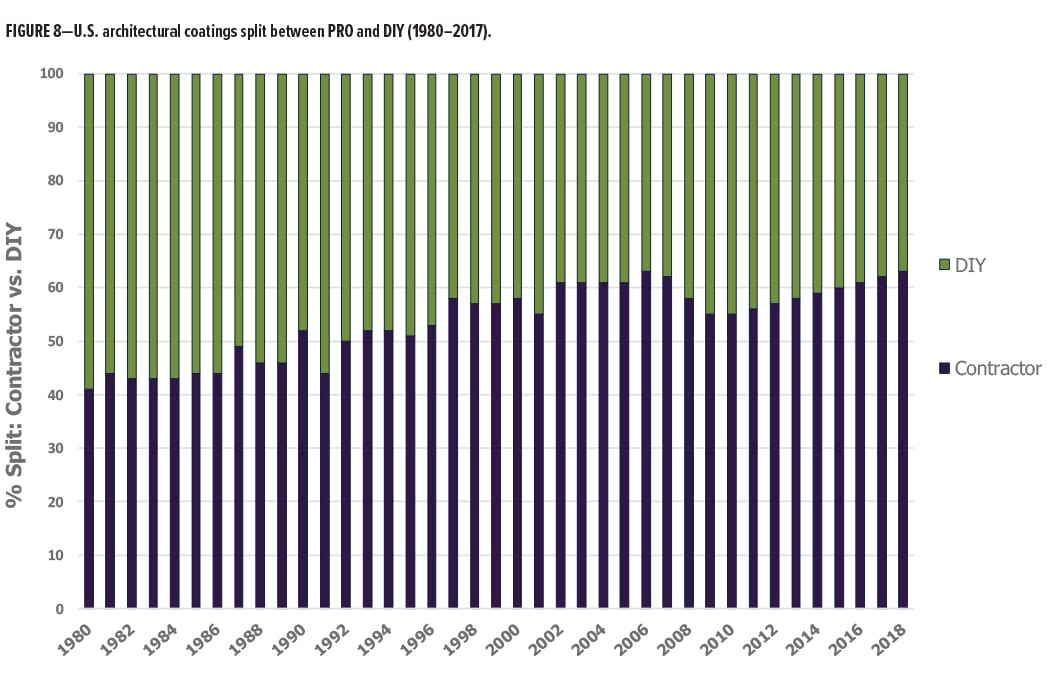 The year 2012 witnessed an upward shift toward contractor-applied paints (“PRO”) following a steep decline during 2006–2010 as a result of the run-up to, and the results of, the Great Recession (December 2007–June/July 2009). This increase in the percentage of PRO-applied paint has continued, unabated, since 2012, increasing the relationship of contractor-applied paint to Do-It-Yourself (DIY) paint to a ratio of 62% to 38% in 2017, the highest that this ratio has been since 2006 (Figure 8). Barring any unforeseeable economic events, this upward shift toward contractor-applied paints will very slowly continue through 2019, when it is likely to stabilize for a period of time around 63–64% PRO-applied paint. The reasons for this growth are largely demographic:
- Baby Boomers are aging, and as they age, they are moving away from DIY and toward PRO
- Both husbands and wives of Gen X need to work, and are less likely to undertake any type of DIY activities than are single-earner households. The “DIY factor” is not, therefore, very significant with Gen X
- Consumer confidence is very high in 2018, and many consumers who would otherwise do their own painting are feeling good enough about their circumstances that they feel safe in splurging a bit and paying someone else to “Do It for Me”
- Home ownership for Millennials will be delayed from their mid-twenties to their mid-thirties—many are unmarried, living at home and/or are unable to obtain credit; as a result, they have not yet entered DIY territory
Convenience paints (“2-in-1”/“Primer and Paint in One,” etc.) continue to perform well for the architectural segment, although sales have slowed somewhat as it has become increasingly clear that many of these products still require a primer when painting over certain background colors, and a second coat of topcoat, depending upon the color. Nonetheless, consumers are increasingly concerned about the demands on their time, and are looking for time-saving DIY products perceived to address that need. PRO painters, however, still prefer primer + topcoat systems, and are unlikely to embrace the “paint plus primer in one” concept between now and 2023, if ever.
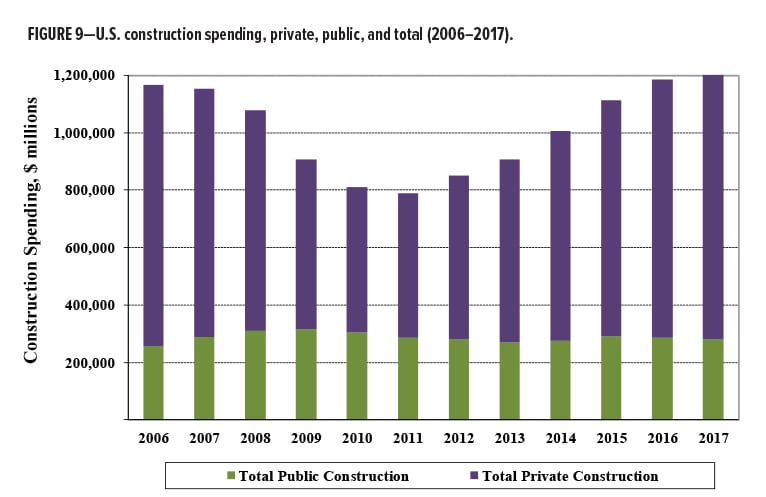
Because the architectural coatings segment is so intimately related to construction, it is positive news that construction in the United States continues its prolonged recovery from the unprecedented low point experienced in 2011. Total construction spending exhibited year-over-year (yr/yr) growth of 7.9% in 2012; 6.6% in 2013; 11.0% in 2014; 10.7% in 2015; 6.5% in 2016; 4.1% in 2017 and is anticipated for grow to 5% during 2018, as a result of increased construction in the public sector—offices, schools, healthcare facilities, public buildings and industrial facilities. While impressive, these years followed five years of declines from the 2006 peak, which drove overall construction spending down ~32%. This strongly suggests that there is further growth potential for architectural coatings during the period 2018–2023 (see Figure 9).
 Architectural paint sales are particularly impacted by the private sector, and in 2017 existing home sales were up 2% over 2016, and new home sales were up 10% over 2016. Housing starts are projected to reach 1.31 million units in 2018, up 9% from 2017, with the potential for reaching 1.39 million units in 2019. The seasonally adjusted annual rate (SAAR) of housing starts for April was 1.29, up 10.5% yr/yr, but down 3.7 sequentially.
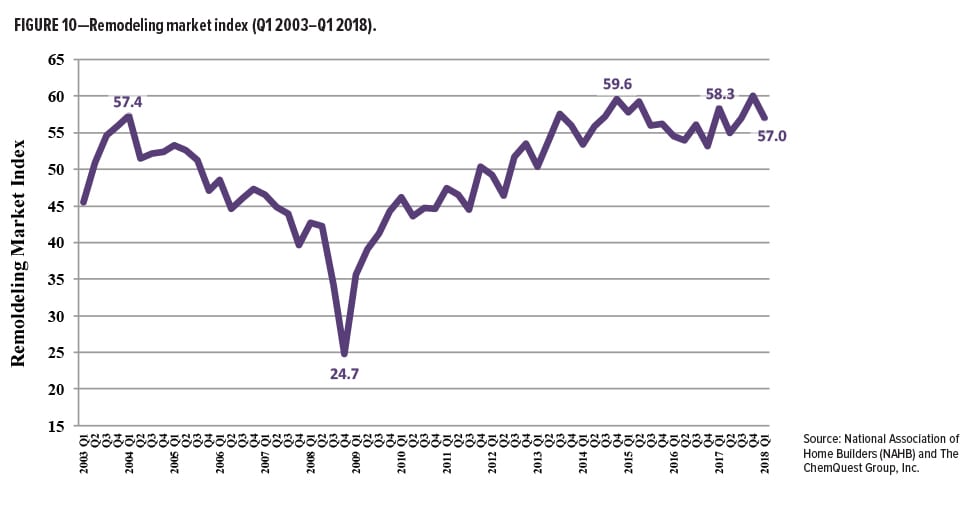
Even more important is the sales of existing homes, since as much as 75–80% of architectural coatings are related to existing home sales and remodeling. In Q1 2018, existing home sales were down 2% yr/yr, compared to new home sales, which were up 6%. Homeowner improvements also play a very significant role in the sales of architectural coatings. As can be seen in Figure 10, after a dramatic drop in the Remodeling Market Index from 57.4 in Q1 of 2004 to 21.9 in Q4 of 2008, it rebounded to a new high of 59.6 in Q4 of 2014 before dropping to 53.1 in Q4 of 2016 and starting Q1 2018 at 57.0.
Industrial OEM
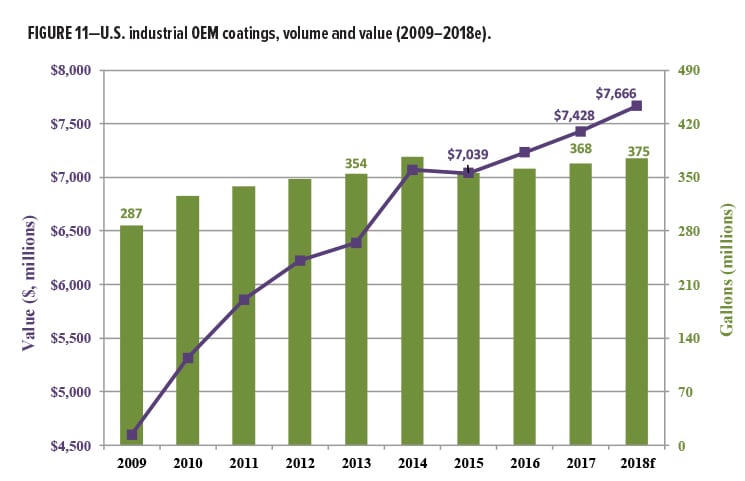
During 2017, the U.S. industrial OEM segment grew 2.7% over 2016 (+1.8% volume; +0.9% price), generating $7.4 billion in sales (~368 million gallons by volume). Industrial OEM coatings are forecast to increase by 3.2% in 2018, with volume and pricing up 2.0% and 1.0%, respectively. Despite good progress, volume in 2017 remained 13% below the most recent peak, which occurred in 2005 (Figure 11).
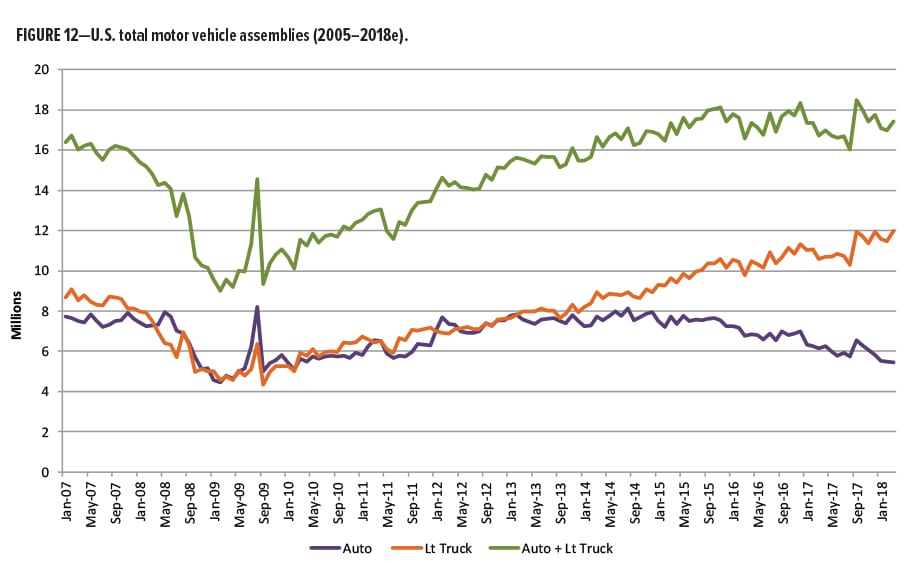 The OEM segment declined in 2017 by 2.8% in the automotive sub-segment (defined as automobiles, light trucks, vans and SUVs; total of domestic production, transplants, and imports), and is forecast to drop another 1.2% (to 17.1MM units) during 2018 (Figure 12).
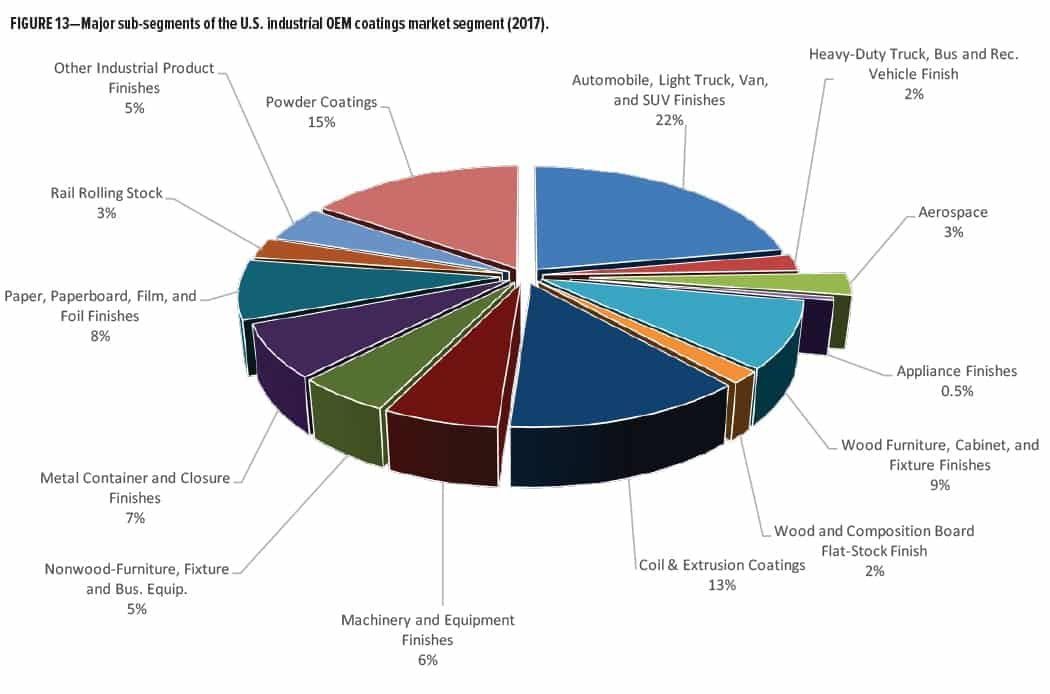
Between Q1 of 2009 and Q3 of 2011, the dollar dropped precipitously, before beginning to rise again, peaking in Q1 of 2017 only to begin a gradual decline that did not begin to reverse until Q2 of 2018. In spite of the recently imposed tariffs, we anticipate that the dollar will continue through 2018 in “sine wave” fashion, and—because of this—will inflict little or no damage of its own on the U.S. economy. The continued recovery of manufacturing in the United States will continue, short of some sort of international crisis, growing at a moderate, rather than stellar, pace. The OEM segment contains over a dozen sub-segments, of which appliances, HVAC, fireplaces, microwaves, rigid and flexible automotive exterior trim systems, brake systems, coil coatings, and wood furniture and cabinets are just a few representative coatings areas (Figure 13). As a result of this diversity of goods, the industrial OEM segment tends to be driven by a variety of factors, although most are involved either directly or indirectly with the macroeconomic environment. An example of this is the negative effect that slowing sales in automotive light vehicles has had on industrial OEM coatings, whereas the rising price of oil has had a positive effect on OEM coatings sales for equipment that is manufactured for the fracking process, as a result of the cautious resumption of that activity.
Major trends in the OEM market segment are driven by the need for products that create operational efficiencies (increase productivity/reduce labor/lower cycle times), and increase sustainability (reduce CO2 footprint) and innovation (infrared reflectance/noise vibration/insulation). Overall 2018 sales are expected to grow 2.7%, led by volume, which will be up approximately 1.8%.
Special Purpose Coatings
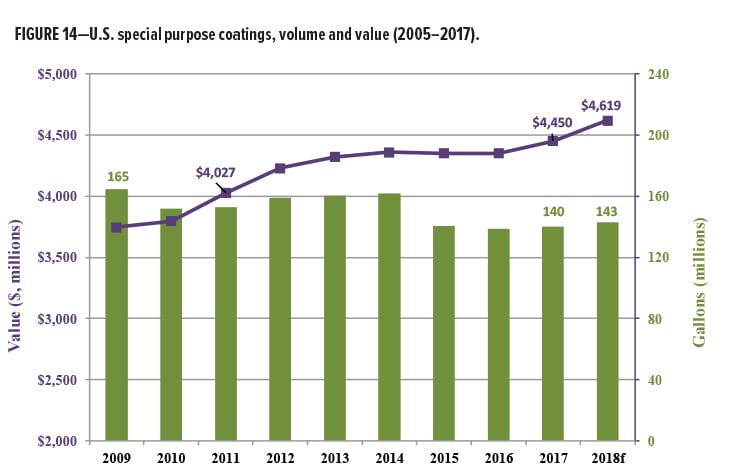
In 2017, special purpose coatings grew at a rate of 2.3% (+1.3% in volume; +1.0% in price), and contributed $4.5 billion (~140 million gallons) of the $23.4 billion generated by the U.S. paint and coatings industry. This represents only 10.9% of the volume, but 19% of the value, of all coatings produced. In 2018, we are expecting a very slight increase in the value of special purpose coatings, from $4.5 to $4.6 billion, with gallons increasing from 140–143MM gallons (Figure 14). This represents forecast sales dollar growth of 3.8%: +2.0% in volume and +1.8% in price.
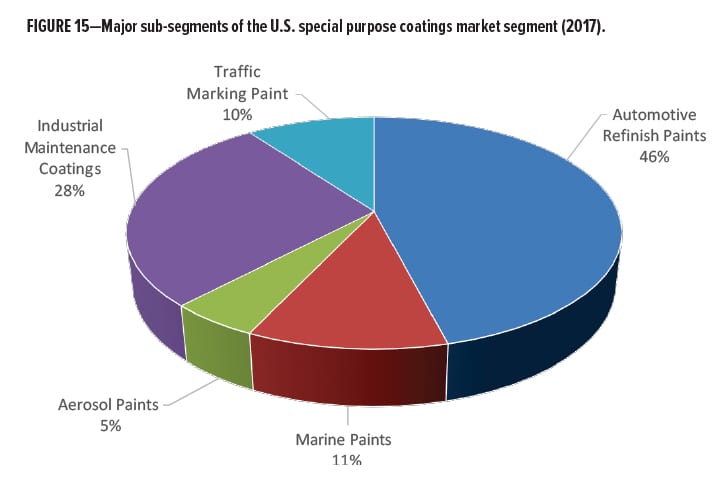
The special purpose coatings market segment serves far fewer end-market segments and sub-segments than are served by industrial OEM coatings, but—as an overall segment—typically commands higher margins than OEM coatings. The major end-markets for special purpose coatings include automotive refinish, industrial maintenance/protective coatings, traffic-marking paints, marine coatings, and aerosol paints (Figure 15).
Marine coatings are directly related to shipbuilding activity which is cyclical in nature and demand for which has softened, beginning in early 2015 as a result of a relatively severe slump caused by market deterioration in the flagship bulk ship market. The Chinese shipwrights were hurt the most by this slump—the general opinion of the analysts is that Korea and Japan have high-performance ship technology that is superior to that available in China, so the remaining business in this sector is resident in those two countries. Because shipbuilding is concentrated principally in South Korea, Japan and China (40%, 30% and 24%, respectively), this leaves only a 6% share of the global market for all other countries. For this reason, shipbuilding is not a driver for the sale of marine coatings in the United States, where marine coatings primarily address the needs of pleasure craft, military ships, platform and offshore supply vessels, etc. For the rest of the world, however, it seems likely that 2018 will show an uptick in shipbuilding activity—orders for Q1 of 2018 were up significantly from Q1 in 2017.
Improved education of the populace with regard to safer driving habits, as well as the advent of safer and “smarter” cars that are making it easier for drivers to avoid accidents—and to minimize the amount of damage when an accident does occur—with an assortment of devices from energy-absorbing bumpers to back-up cameras and automatic controls that keep cars from accidentally crossing the center line, U.S. automotive refinish paint volume had been dropping, at a rate of roughly 0.5–0.7%/year, through 2010. This made sense, insofar as automotive refinish paints are indirectly tied to the number of miles driven and directly tied to the accident rates. Between 2010–2014, this trend appeared to reverse itself, and automotive refinish paint volume not only stabilized but increased. This was partly the result of a “pent up demand” factor at work, as car owners delayed fixing cars damaged during the Great Recession of 2008–2009 until the economy began to look somewhat better in 2010–2011. Another major factor has been the high number of new cars on the road, since car owners tend to have scratches and minor dings repaired on a new car, but not on an older car. Finally, the accident rate has been negatively impacted by the newest driving distractions in the form of activities such as talking and texting while driving and glancing at GPS screens. We believe that the apparent reversal of this trend over the past three to four years is temporary, however, and expect to see automotive refinish coatings trending downward again in volume by 2020–2023, as distractions are reduced and safety factors enhanced.
Value for automotive refinish coatings has historically been quite high, and in the past, it was fairly easy for producers to increase prices by 4–5%/year, and—because the cost of the paint was so low relative to the cost of labor and other materials to repair a car—such price increases were rarely challenged. It is, therefore, quite a change to forecast that selling price, rather than being routinely increased by 4–5%/year, is now entering an era in which the ability to raise prices will be more dependent upon inflation and general economic circumstances, which resulted in price increases (realized, not announced) for 2018 of 2.8%, and we forecast that they will be closer 2.7% for 2019 and 2.6% by 2020.
The Industrial Maintenance (I/M) market segment (also referred to as the “Protective Coatings” market segment) represented volume of 39.2 million gallons valued at slightly under $1.3 billion in 2017. I/M coatings are tied very heavily to construction, maintenance of medium- and-heavy duty facilities such as petrochemical and wastewater treatment plants, and oil and gas production—and indirectly tied to the global price of crude oil, as a result. In 2017, the I/M market sector benefited from the uptick in construction activity, as the commercial and public sectors finally began to show signs of life following a very slow recovery from the Great Recession. Contributing to this positive activity was the increase in the price of crude oil, which had fallen to slightly more than $30/drum over an 18-month period, beginning in mid-2014 and bottoming out in January of 2016. This caused a considerable slowdown in fracking activity, and a reduction in demand for the equipment, pipelines, etc., that are necessary to support this activity—all of which are coated with I/M paint products. Fortunately, the price of crude began rising almost immediately, and by 2017, rising oil prices helped to encourage the re-opening of both capped oil wells as well as cautious resumption of fracking activity. Going into 2019, we expect to see the price of crude stabilize in the $70–$75/barrel range.
“Bottom Line,” from a purely economic view? The numbers, trends and drivers presented thus far all point to stable, somewhat faster growth in the paint and coatings industry through 2019 and perhaps for a couple of years beyond then. Data generation, however, just provides us with puzzle pieces with which to assemble a picture of “how things looked last year, look this year, and are likely to look this coming year.” That’s sufficient for the majority of companies in the paint and coatings industry, for whom we are happy to provide this information. . . .
. . .It is not good enough, however, for those companies that are less concerned about this year (or this quarter or this month) than they are about 5–10 years from now. Such companies fully understand that possession of data is always comforting. It gives us the feeling that we are in control—the feeling that armed with fundamental information about our industry, we will automatically have an understanding of that industry, which will in turn confer safety and prosperity upon both the present and the future of our individual businesses. . . .They also understand that nothing could be farther from the truth. The possession of data is falsely comforting.
Financial and trend data only have value if they are used to help coatings producers make strategic decisions regarding where they are going to position themselves in the future, based upon the predictive ability of information available in the present. These companies understand this, and they are only too aware that an industry that is technology-based is constantly in need of newer, safer, more durable, more damage-resistant and more sustainable products. For these companies, making money in order to stay in business this year is necessary—but creating new products to stay in business in the future is absolutely mandatory. This requires having a strategy—a plan for future success that is as rare as it is necessary in the second decade of the 21st century. For these companies, data is important, but action, in the form of innovation, is mandatory.
The only way in which the creation of strategy can be effective, however, is with unswerving support from the top of the organization, and a deeply committed working relationship between Marketing and Technology—a cooperative effort between those whose antennae detect the direction in which the wind is blowing, and those who can develop the products that are able to follow the wind to new and exciting destinations. This must then be supported by a mutually constructive and mutually lucrative relationship between the technical team of the coatings company and the technical team of its key raw material suppliers. This latter group is often seen as being very passive—one frequently hears coatings people bemoaning the lack of “new raw materials,” which is simply just not true. There are a lot of raw materials being introduced every year—raw materials that are not just “me too” products or “tweaks” of existing products, but new materials that truly do have the potential to “make a difference” to the coatings formulator who needs to create properties that do not currently exist. I see such materials every year, and—without endorsing or recommending any of them on behalf of myself, ChemQuest or CoatingsTech—I have listed them in the Appendix to this article simply because I understand that the products in this random and arbitrary selection of raw materials have all been introduced within the past 18 months, and recommend that paint formulators take a look at them, if they appear to address any properties that would be helpful to have. Since it is often difficult to convince paint makers to look at new raw materials, suppliers of new materials should also give serious consideration to having their new products tested and validated in a variety of coatings technologies by independent, third-party laboratories that can provide unbiased results that can then be presented to the paint formulators as “proof of concept” documentation.
The years between 2018 and 2023 will be good ones, but the forces that account for this are already in place—each individual coatings producer has the ability to make tactical decisions that will either take advantage of the underlying economic, demographic, regulatory and sociological forces, or run counter to them and pay a high price for doing so. The real question, therefore, is not “what should we be doing between now and 2023,” but “what should we be doing NOW to prepare for the years BEYOND 2023.” This is where the need for the creation and nurturing of a well-funded, and intellectually empowered Marketing–Technical effort comes to the fore. Any company wishing to harvest the fruits of a truly strategic approach that will place it among the best and most forward-looking companies, not only in 2023 but well into the future, has no choice but to take this path. Strategy IS its future, and a powerful Marketing-Technical/Raw Material Supplier partnership is the key to this strategy.
Appendix
Patcham USA LLC: Pat-Add DA 603, solvent-free polymeric wetting and dispersing agent for a wide range of architectural and industrial paints and coatings; Pat-Add DA 932, High Molar Volume Technology (HMV) polymeric wetting and dispersing agent for industrial coatings and solventborne dispersions; Pat-Add DA 3051, HMV polymeric wetting and dispersing additive with cationic pigments affinic groups; used for co-grinding baking systems. www.patchamltd.com
Tolsa SA (Spain): PANSIL® UltraSpheres, high performance silica alumina ceramic microspheres used as fillers in paints, coatings, mastics and other construction materials, providing improved processing and barrier resistance. www.tolsa.com/en/
Michelman, Inc.: Michem® Wood Coating 44, a water-based additive that provides exterior wood stains and sealants with excellent water-beading properties, designed to improve the weatherability of exterior wood stains. www.michelman.com
Deuteron GmbH: Deuteron SO 100, 300, and 500 are fine elastomer dispersion particles that produce soft and matt surfaces for UV, waterborne and solventborne coatings, respectively. These particles produce soft-feel effects without requiring special elastomeric binders. www.deuteron.com/en/
Wanhua Chemical Group Co., Ltd.: WANNATE® HT-600, a low-viscosity HDI isocyanate, offering lower viscosity and better flexibility; suitable with polyols and resins to formulate light-stable 2K solvent-free or high solids polyurethane coatings. www.whchem.com/en/
Eastman Chemical: TETRASHIELD™ family of solventborne polyester resins; MPR2000 for metal packaging, AC1001 for automotive monocoats, IC3000 for 1K industrial coatings, IC3020 for 2K industrial coatings; providing superior chemical, corrosion and scratch resistance, a unique combination of flexibility, durability and higher solids. www.eastman.com/Brands/Tetrashield/Pages/Overview.aspx
Wacker Chemie AG: SILRES® Dry Erase, a low-odor, 1K system, providing coatings with dry erase functionality. www.wacker.com
BASF USA: EFKA IO ionic fluids, providing anti-static properties to paints, which reduces dust accumulation in hard-to-reach places such as baseboards and crown molding. www.basf.com
Reichhold: Beckosol AQ® 210, a chain-stopped medium oil alkyd latex resin based on bio-renewable oils, which requires no coalescing solvent for film formation. www.reichhold.com; www.polynt.com
Heubach GmbH: HEUCOPHOS® CMP, a zinc-free anticorrosive calcium magnesium orthophosphate, suitable for use in a variety of waterborne and solventborne coatings; suitable for air-dry and baking system, either 1K or 2K. www.heubachcolor.com
Micro Powders, Inc.: Polyfluo® 523AL, an engineered high-density polyethylene/PTFE/alumina nanocomposite offering unsurpassed scratch and scuff resistance. www.micropowders.com
BYK Additives & Instruments (part of Altana AG): BYK-3565, a macromer-modified acrylate additive that raises the surface energy without affecting the surface tension, which improves repaintability, while also improving flow and leveling. www.byk.com/en/
Magonarez s.l. (a Spanish company, and available in the U.S. through StanChem Polymers): PF-030-AC, PF-033-H-AC and PF-035-AC are surfactant-, oligomer-, and ammonia-free polyacrylic co-polymer emulsions for wood, furniture and parquet coatings, offering hardness, sandability and block resistant properties; coatings may be formulated at very low VOCs. www.magonarez.com
allnex (formerly Cytec Industries): CRYLCOAT® E 04482, a carboxylated superdurable polyester resin, designed for use with TBIC, providing excellent flexibility, flow and surface appearance. www.allnex.com
Mace Polymers & Additives, Inc.: MaceKote HFR 3102-Z, polyester PUD halogen-free, NMP-free, flame retardant; suitable for use in textiles and automotive interior applications. www.maceco.com
American Colors® Inc.: UCF and UCG product lines; liquid colorants utilizing a polyether triol, with molecular weights of 5000 (34 hydroxyl number) and 6000 (28 hydroxyl), respectively, used for injection molding, urethane foam, adhesives/sealants, and urethane films; TBA, a VOC-exempt, resin-free liquid colorant line, has wide compatibility in solventborne coatings, including alkyds, acrylics, and urethanes. www.americancolors.com
The Lubrizol Corporation: Aptalon™ N8100, a waterborne, self-crosslinking polyurethane dispersion using Aptalon polyamide technology in the backbone; offering enhanced weathering resistance, hardness and chemical resistance. www.lubrizol.com/aptalon
Interpolymer Corporation: SYNTRAN® PA1475, an acrylic-olefin wax-grafted emulsion, offering superior wear properties and slip resistance; pH 9.2, 38% solids, with a melting point of 85–105°C. www.interpolymer.com
Cardolite Corporation: NW-9203LP, a Cashew Nut Shell Liquid (CNSL) polyol (100 hydroxyl value), with hydrophobic properties (due to the long aliphatic chain of cardanol), no hydrolyzable ester bonds, with excellent water resistance, less moisture sensitivity, and excellent thermal stability due the aromatic structure of CNSL. www.cardolite.com
Supreme Dyechem: SURPLUS 515001 and 515002 are Blue 15:0 phthalocyanine blue pigments for coatings, printing inks and plastics, which are stabilized with Supreme’s own line of additives. Their pigments have been manufactured in India for 10–20 years, and are now available in the United States. www.supremechemicals.com
AB Specialty Silicones: A U.S. manufacturer of specialty silicones, including the Andifoam line (100% active, used where aggressive foaming occurs), the Andifoam DFC line (100% active blend of silicon glycol, polydimethylsiloxanes and silica, offer outstanding persistence), the Andifoam DFG line (a silica-filled polydimethylsiloxane antifoam), and the Andisil® line of siloxylated polyethers used as performance modified for antifoams. www.andisil.com
Specialty Polymers, Inc.: RayCryl® 1008 and 4133, core-shell acrylic emulsions, modified with epoxy and silane, respectively. RayCryl 1008 can be used in concrete sealers, providing excellent resistance to dirt pick-up, hot tire prints, and blocking. RayCryl 4133 provides excellent chemical and stain resistance and hot water blush resistance in wood coatings. RayCore® 9570 is a polyurethane-acrylic hybrid polymer for wood coatings, which provides excellent stain resistance and ease of formulating with low-odor acrylic latex. RayVace® 692 is a vinyl acrylic/vinyl versatate terpolymer for concrete and masonry. RayCryl 1247 is core-shell emulsion ideal for ultra deep base paints. www.specpoly.com
Stahl Polymers: Relca® PD-805, a next-generation matting resin, providing greater hardness and durability to coatings, while improving the applications properties and smoothness of the coating. www.stahlpolymers.com
* “Creating a Marketing–Technology Complex: Strategizing for the Future,” CoatingsTech, 12, (8), 24–33 (August 2015).
CoatingsTech | Vol. 15, No. 8 | August 2018