
By Ralph Jan Wörheide, ORONTEC
Introduction
When it comes to color testing, there are many precise instruments, color correction software packages, automated spray machines, etc., in the marketplace. Colorimetry is a science of great importance to the paint industry, especially in meeting the high-quality standards of customers. However, the high scientific level and the precision of the instruments cannot compensate for the challenges presented, because conventional color testing takes place at the very end of the paint production process and requires a great deal of time due to the drying process. In addition, it has become state-of-the-art to correct colors instead of producing them in the required quality in the first run.
Liquid Color Measurement: An Approach for Color Measurement of Liquid Paint and Pigment Preparations
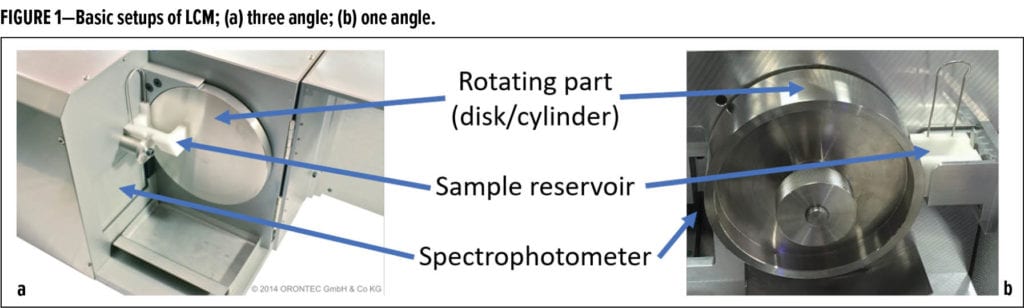
The liquid color measurement (LCM) system discussed here is based on a machine layout, where an opaque liquid (paint or pigment preparation) is put on a moving part and measured touchless with a spectrophotometer. In a three-angle layout, this is done on a rotating disk and the measurement is carried out at 25°, 45°, and 75° angles (Figure 1a). In a one-angle layout, the liquid is placed on a rotating cylinder, and the measurement is carried out at a 45°angle (Figure 1b).
The setups are characterized as follows:
- The liquid is held in a reservoir (approximately 30 mL), from where the paint is permanently re-mixed and the film is freshly applied continuously on the moving part (disk or cylinder).
- A film thickness of approximately 800 mm allows for an opaque film for several materials.
- The optical components of the spectrophotometer measure touchless through the air, which avoids influences, such as glass barriers, that are experienced with other methods, such as with cuvettes or glass probe measurements.
The test process, including the cleaning of the equipment, takes less than three minutes. The integrated spectrophotometer is calibrated automatically without any need for manual calibration.
Integrated software controls the equipment and generates, stores, and evaluates the measured data. All values are stored as spectral data in an SQL database, either locally or hosted on the intranet or on a cloud system.
Color Metrics
Measuring color in liquid has several characteristic aspects, including the correlation of liquid and dry measurements, the repeatability of measurements, and usability.
Correlation between Liquid and Dry Measurements
If a supplier and a customer define a color to be used, it is related to the color of the dry film. Color metrics on a liquid film, as generated by the LCM system, can be used as a relative measurement setup for the detection of differences between a standard and a sample of a paint system.
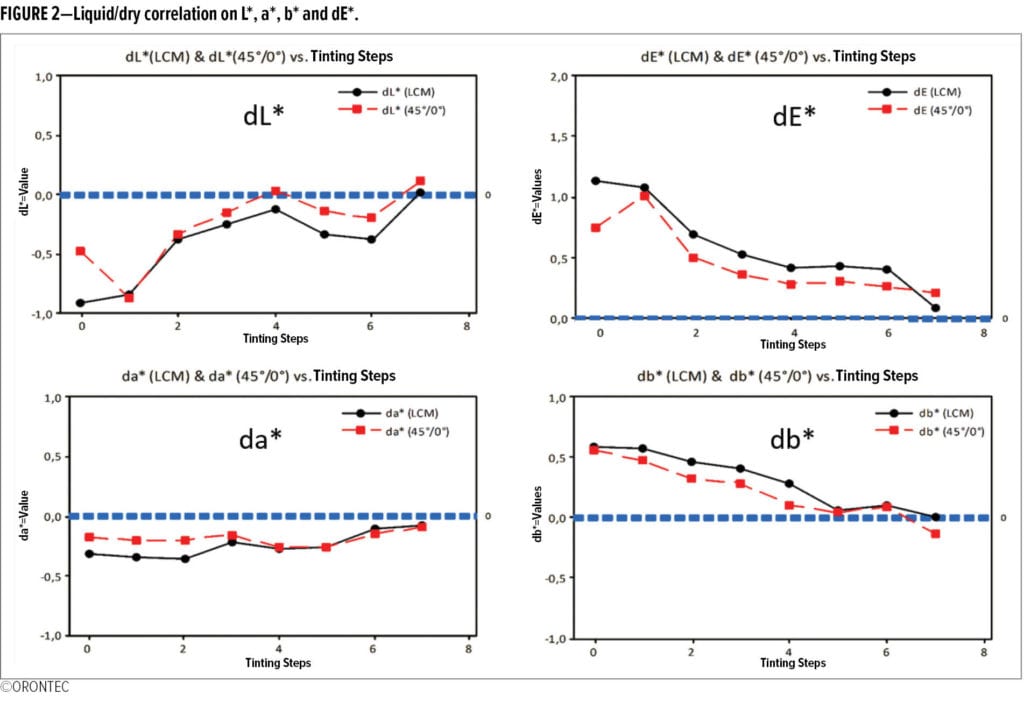
Figure 2 shows the correlation of measured differences in the L*, a*, b* space of liquid and dry samples against a (liquid and dry) standard in a production setup with correction steps 0 (initial batch) to 8. The black line represents the differences in liquid against the liquid standard, and the red line represents the differences in dry against the dry standard. Several tests have proven that a liquid measurement shows differences that are equal or similar to what a dry measurement would show.
Repeatability and Reproducibility
Usually, repeatability of a spectrophotometer is specified on a white tile. This represents the repeatability of a measurement, not a test process. The setup of an LCM consists of a spectrophotometer and a machine. Carrying out measurements on an LCM device is not limited to the measurement of a color; it also includes a part of the test process. A conventional, i.e., dry test process, for a color sample consists of the following steps: sample taking, sample preparation, application, drying, eventually tempering, and the measurement. With LCM, the process is streamlined so the application, drying, and tempering steps are not necessary.
Sample taking and sample preparation are the same in both liquid and dry testing methods. The application, drying, and tempering process adds variance to the color of the sample, which can be generated by flocculation, sedimentation, or—in case of effect pigments—orientation of the pigments depending on the drying conditions. The dry testing process adds deviations from the pigmentation of the liquid paint and deviations of the application process.
The application of the LCM is limited to handling the material in a liquid condition and generating a liquid film. This influence is minimized due to its low complexity, low shear, and constant conditions, such as the speed of the disk/cylinder and the time between the filling and the measurement.
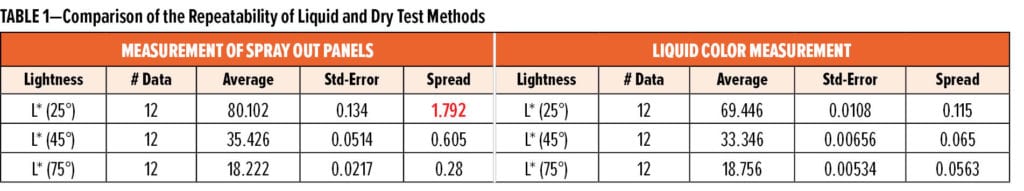
Table 1 shows an example of a silver metallic paint, where 12 samples were prepared. Out of the same sample, four panels were generated and measured three times each. From the same sample, 12 measurements were carried out in an LCM device. In this example, the repeatability of the liquid test process was down to 1/10 of the repeatability of the dry process.
The repeatability depends on the material characteristics of the paint system. Rheology and interactions of the colloids can influence the repeatability. The values, which have been found in white liquid paint systems, range between dE = 0.01 to dE = 0.04 as an average value of three measurements, including cleaning and refill of the material.
Color Strength
Color strength is a relative measure and is used in the paint industry as a quality index, e.g., for tinting pastes. There are several formulas available, as described in EN ISO 787-24.
In a production scenario, the information about color strength of intermediates can help to reduce color variations of the finished products.
The test method (color measurement) and the mathematics for calculating a color strength value show a good correlation to the concentration of a tinting paste in the formula. If such a correlation can be mathematically described, it could be used to compensate for color strength variations in a mixed paint by reducing or increasing the amount of tinting paste against the original recipe, which is usually formulated with a color strength of 100%.
In a study, the following questions were addressed:
- Is there a possibility of describing a linear correlation between the color strength of a tinting paste and its concentration with a weighted function based on the spectrum?
- How does the LCM perform against a drawdown process, which is usually used for color strength testing?
Linear Correlation between Color Strength and Concentration of a Tinting Paste
According to DIN EN ISO 787-24, color strength is defined in a white reduction. For the study, different concentrations of a tinting paste were generated by mixing the paste in different ratios with white. Table 2 shows the different mixtures of a tinting paste with white. Assuming that there is a linear relationship with a slope of 1, there would be a theoretical concentration in percent as shown in “CStheo.”
Two different methods were used for the measurement:
Drawdown application, drying, tempering, and measuring with a conventional laboratory spectrophotometer
LCM with direct measurement of the liquid mixture
The mixture 5.00 g/95.00 g was set as the standard as the reference to the relative color strength calculation. The calculation itself was made with the standardized color strength calculation formula according to DIN EN ISO 787-24.
In a second step, the differences between the measured color strength and the theoretical (expected) color strength were compared in a graph. For example, the expected color strength difference of the 5.25 g/95.00 g mixture would be 5%.
Figure 3 shows the results of the dry process. The red line shows the theoretical plot in the case of an ideal correlation between dCSmeasured and dCStheo. It can be seen that the points are a certain distance from this ideal plot, which leads to a confidence range, shown as green lines.
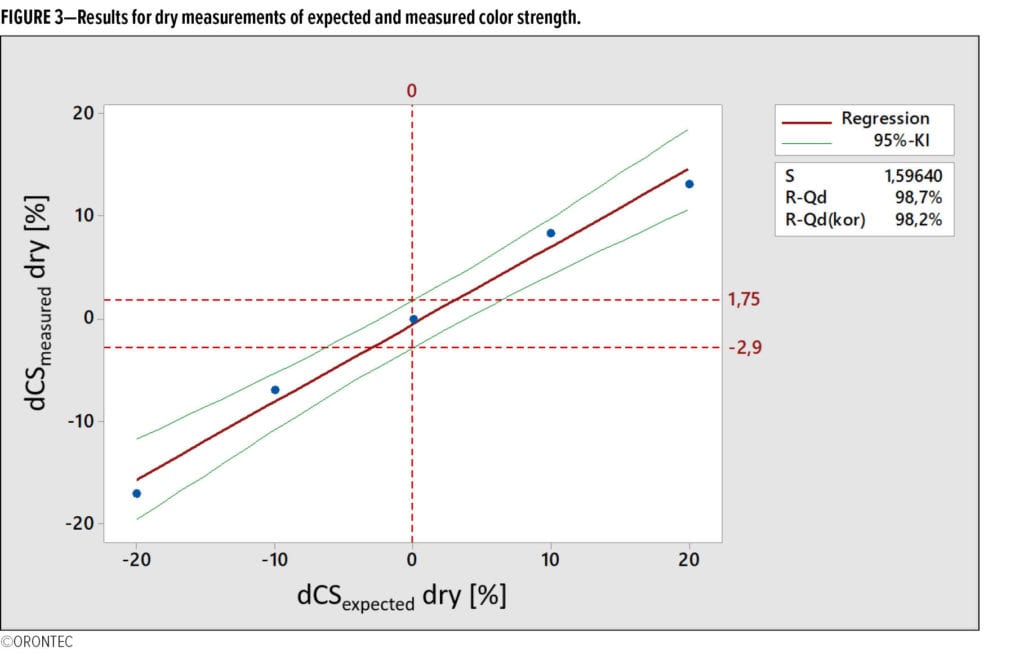
Figure 4 shows the results for the liquid process. The values are much closer to the ideal line and the confidence range.
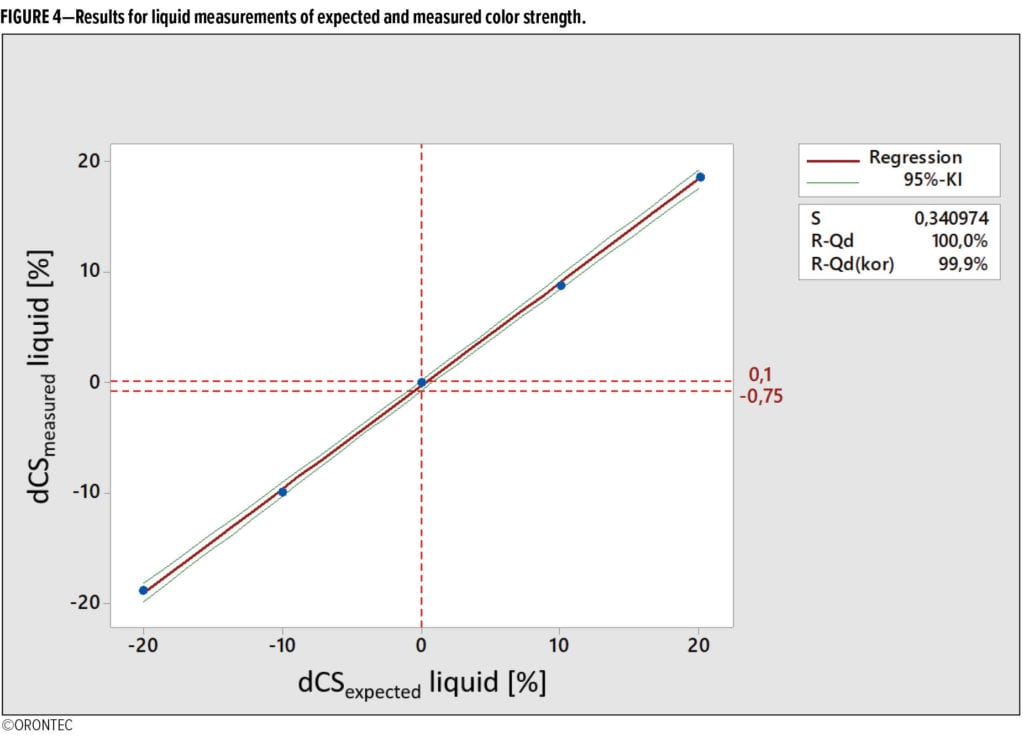
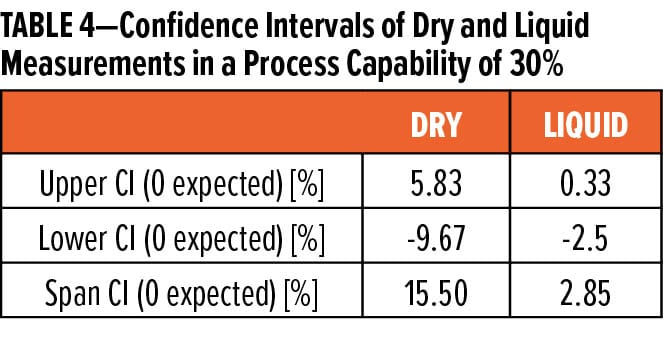
In Table 3, the results are compared at the point of a dCStheo of zero. The difference between the upper and lower confidence interval is 4.65% for the dry process vs 0.85% for the liquid process.
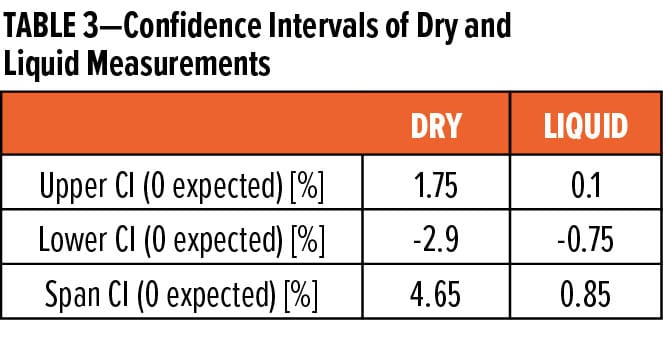
Table 4 shows the minimally acceptable difference. Even if the tolerance of 5% is set to the process, the dry process is not capable with this material.
Effect Pigments and Their Preparation
The three-angle version of the LCM system is suitable for the measurement of liquids containing effect pigments. These can be pigment preparations, e.g., for raw material control, slurries as semi-finished products in a production, or finished paint systems. The multi-
angle capability is due to the design of the system, because the flow conditions between the reservoir and the disk allow an orientation of the particles, which can then be measured by the spectrophotometer in a defined sphere.
This possibility enables paint and raw material producers to test paint systems and pigment preparations without the influence of the application, which is usually very high in connection with effect pigments. As seen in Table 1, the liquid color measurement displays better repeatability than the conventional dry process connected with a spray application.
At the interface between a pigment supplier and a paint manufacturer, the LCM system can help to harmonize the specification of a material. Figure 5 shows an example of an aluminum slurry of batches A and B, where the spectra of the three angles (25°, 45°, and 75°) are shown.
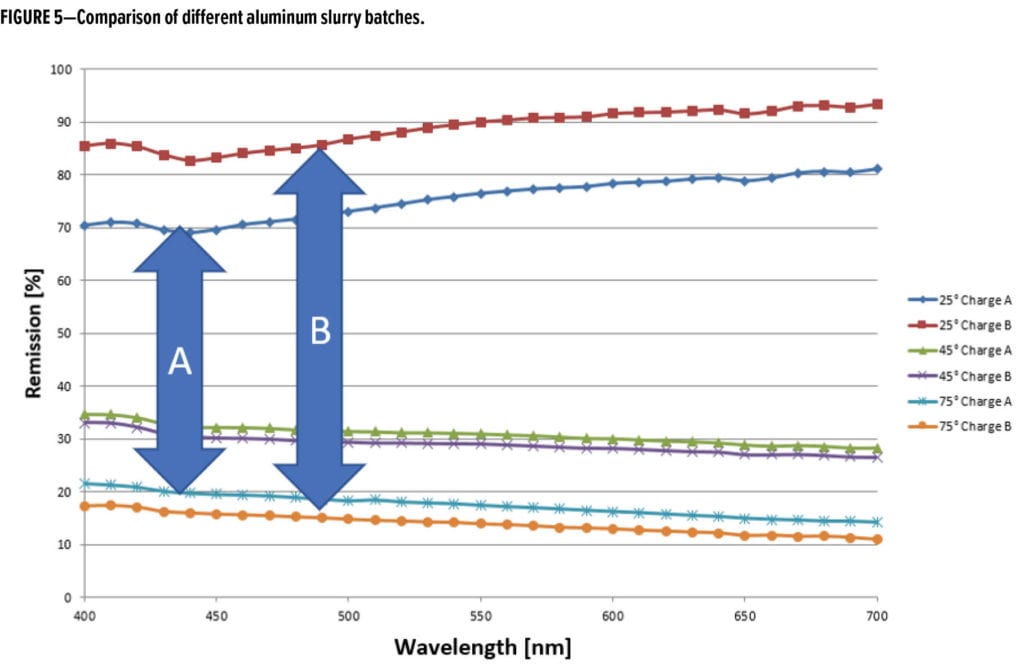
Both batches were specified by the supplier as being the same product quality. Using the LCM system revealed that there was a significant difference between both batches, especially visible in the difference of the reflection in the 25° angle. Without using the LCM system, both batches would have been used in the same way for the same finished product and would have led to much effort for correction.
Black and Dark Colors
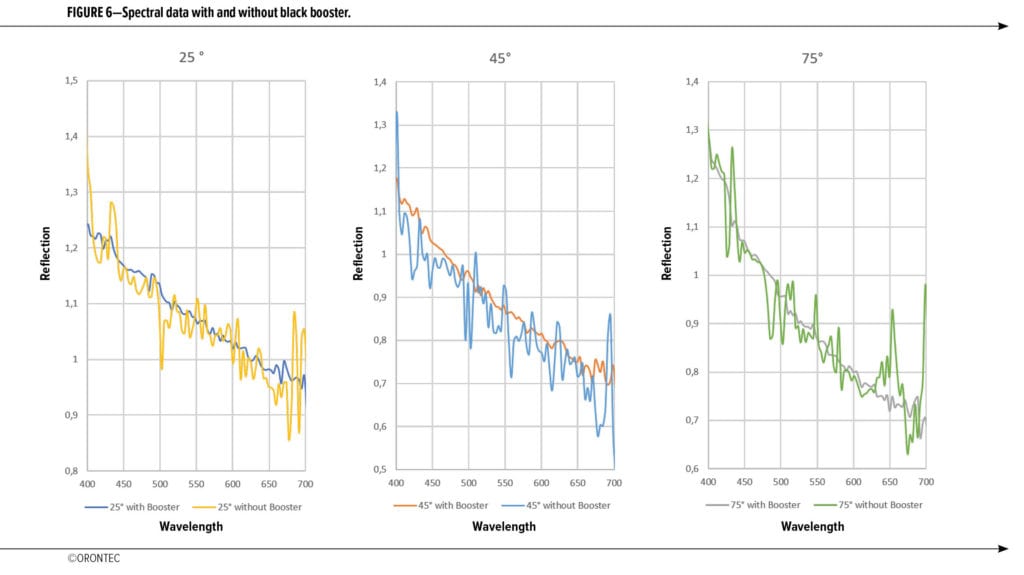
The spectra of black and dark colors show ranges of very low reflection. For a spectrophotometer, this leads to a low signal-to-noise ratio and thus to a fluctuation of values at the different sampling points of the spectrum. The LCM system uses a feature called a “black booster” to increase the energy used for the illumination of the sample, which increases the signal-to-noise ratio and decreases the fluctuation at the sample points. Figure 6 shows this in the three angles of the measurement of a black paint, comparing the values with and without using the black booster.
Stability Test
Using the LCM system can also indicate the stability of a paint system or a pigment preparation. For such a test, several measurements are repeated while the film is left on the rotating part (disk or cylinder). In normal operation, the paint is removed from this rotating part after each measurement.
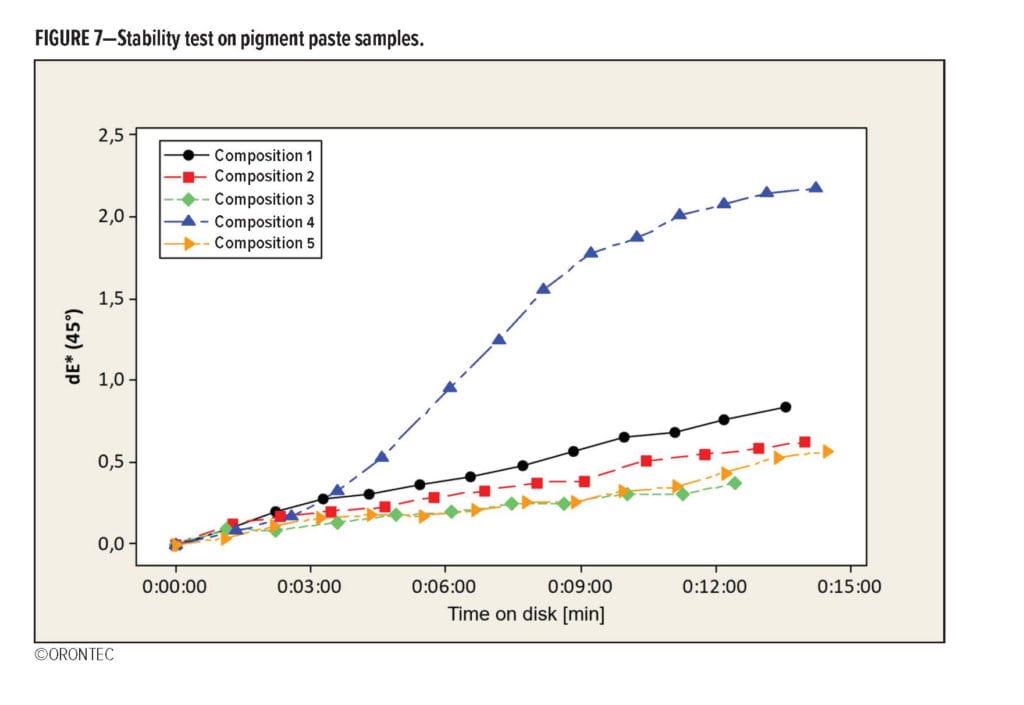
The color drift, which is calculated as the dE* against the first measurement of the test, is an indication of how stable the material is formulated. This stability is not specified as a specific physical behavior, it can be caused by flocculation, separation, and other phenomenon, which disturb the distribution of colloids in the matrix. In practice, this method is used as a differential method for the formulation of paint, e.g., in connection with different surfactant types.
Figure 7 shows the different compositions of a pigment paste when tested. The only difference between the samples was the surfactant. Obviously, the mixture represented by the blue line was the worst formulation. However, the black and green lines show significant differences as well.
Process
The LCM system reduces the amount of time for color testing. In a batch production, the testing time for color equals production time, because the next step in the process depends on either the approval for release or correction instruction. A reduction of testing time leads to a reduction of the cycle time of a batch production process.
In many production scenarios, a parallel production of batches takes place. Batches are initiated, stirred, and mixed, and in the case of mobile tanks, taken away from the stirrer. This process is repeated with more batches and several mobile tanks are handled in the shop floor.
A significant reduction in the testing time leads to a “one piece flow” operation of the production, which means that initiated batches are manufactured in one process instead of several parallel processes. Thus, using a quicker test method not only reduces the cycle times by a total reduction of the test time, but also changes the production sequence from parallel to serial production.
The possibility of standardizing semi-finished products reduces the total amount of corrections, because the initial batch is already closer to the target if each of the used components is closer to a standard.
The LCM system leads to a broader use of color testing in the supply chain, as illustrated in Figure 8. Starting from the testing of pigments, it also helps to test semi-finished products and, finally, finished products.
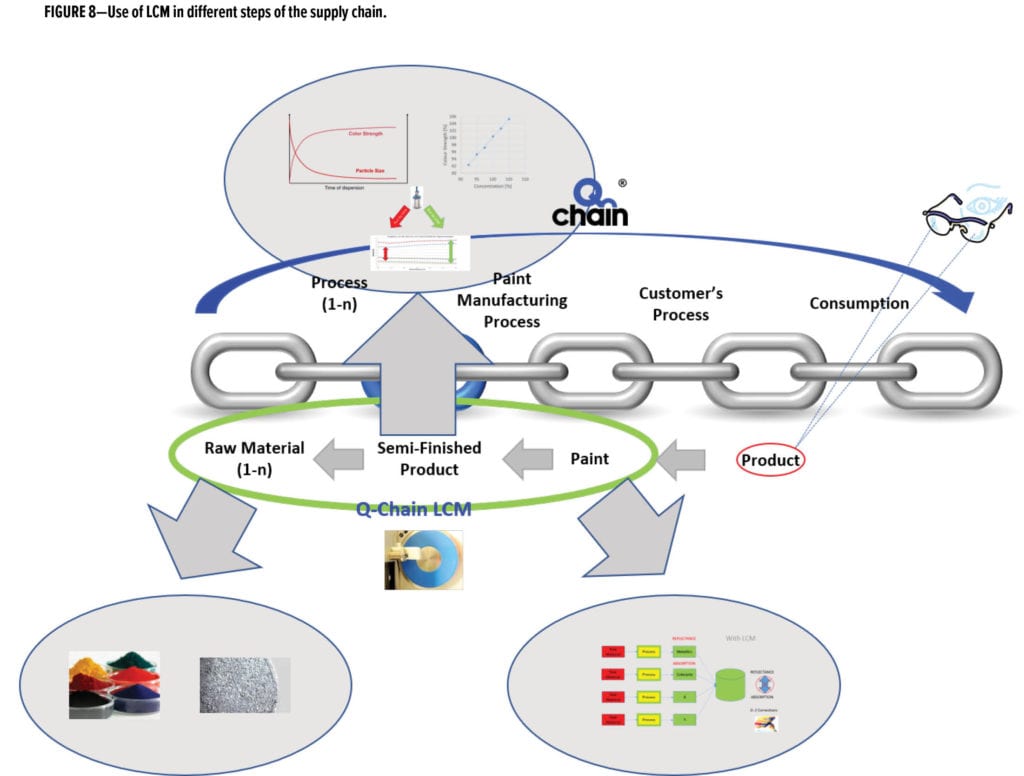
This leads to a reduced color variance that can occur in the different steps in the supply chain.
Prospects
The LCM system is a tool for manufacturers at different steps of the supply chain—reducing testing time with a possibility for process optimization. It enables a harmonization of quality standards in these steps and accelerates the communication and management of the supply chain process. A data exchange can be managed, e.g., by a cloud system, which supplies data for the IT systems of the manufacturer.
In addition, faster generation of color data in different production steps supports the idea of a big data analysis, which finally helps in understanding the process and leads to improved tools for process control.
Together with software tools, the system contributes to the possibility of a “smart” paint factory. This is a vision of paint manufacturing in the future, where all value-added processes, including manufacturing and customer service, are characterized by a high degree of flexibility and self-learning processes. The latter, as a discipline of artificial intelligence (AI), requires a high degree of digitalization of all relevant processes plus valid data. Using the LCM system is a suitable approach for generating precise and relevant digital data, with the possibility for feedback deviations into a control system for manual or software supported corrections in the beginning of the process. For the future, it will be suitable for generating data for training a machine learning algorithm, which will help in avoiding errors and deviations.
Liquid Color Measurement—A Benchmark
Several attempts have been undertaken to build devices that make liquid color measurement possible. Colorimetric methods are state-of-the-art in chemical analytics, where the color of a (transparent) liquid functions as an indicator of the concentrations of chemicals. Using these setups for opaque paint systems causes some problems, because there are several physical effects which reduce the repeatability of such a measurement.
There are four basic methods available as technical solutions, as follows (see Figure A):
1. Touchless, Dynamic Measurement:
In the touchless, dynamic measurement setup (e.g., the LCM described in this article), a film is applied on an applicator (disk or cylinder) through the slit of a cup. During the measurement, this cup is held on the applicator, and the liquid is remixed in the cup during the rotation of the applicator. In the case of a disk as an applicator and laminar flow conditions in the slit of the cup, aspheric pigments like metallic pigments or pearls are forced into the direction of the rotation. A spectrophotometer measures the color of the film at the surface in a touchless way. In the case of effect pigmented liquids, a multi-angle measurement is possible. By repeating the measurements over a certain time while the material stays on the applicator, it
is possible to quantify the stability of a paint system.
2. Touchless, Static Measurement:
Setups are normally a glass cup, where the liquid is filled in, and a spectrophotometer, which measures the color from the top in a touchless way. When compared with method #1, the disadvantage is that in mixtures of different pigments, the composition on the surface changes because of settling or coagulation or flocculation. Especially for mixtures of pigments with very different density, this process takes place very quickly. This method is not capable of measuring any effect pigmented liquids.
3. Measurement through a Medium:
There are systems available where a glass cup is put on a hole of a spectrophotometer, which measures the color from the bottom. This method has the same deficit as #2 due to the change in pigment composition at the surface—in this case, at the bottom of the cup. The refraction difference between the liquid and the material of the cup (normally glass) has an influence on the color reading. However, this can usually be considered as constant. A more significant influence comes from the tendency of some pigments to have a selective adhesion to the material of the cup (normally glass). This means that in a mixture of different pigments, one pigment has a higher adhesion than the other(s).
4. Measurement by Dive Probe:
This method was taken from the plastic industry, where color measurements are carried out in extruders. A probe with a glass lens at the end is used as the light source and the sensor for the spectrophotometer at the same time. It can be used for inline measurements of solid colors, e.g., in the batch or in pipes, but the repeatability suffers from the adhesion effect (as in method #3) and the cleaning needs a great deal of effort. Additionally, the method requires a high investment and can only be installed at one production aggregate at a time.
Method # 1 is the only one capable of measuring paint systems with effect pigments.

CoatingsTech | Vol. 17, No. 2 | February 2020