

By Victoria Scarborough, Ph.D., The ChemQuest Group
Deciding which technical projects to advance to commercialization is often complicated. Individuals can understandably become attached to projects with unique but unproven ideas or innovations that are not tied to business growth.
To be completely unbiased, the ChemQuest Group regularly uses a tool called the Porter’s Five Forces of Competitive Position Analysis (PFF). Created in 1979, Michael Porter developed the tool to evaluate the intensity and attractiveness of a market shaped by five forces that influence where the power lies in a business situation.
By understanding where power lies, the tool can show areas of strength and highlight weaknesses to help avoid pitfalls. At the end of the evaluation, it is the data that point to the best opportunity for a technology to succeed in a chosen market. It takes some practice to master and interpret the theory, but numerous online resources are available for best practices. The five forces in the PFF process include:
- Supplier power. An assessment of how easy it is for suppliers to raise prices. This is driven by the number of suppliers of each essential input, uniqueness of their product or service, relative size and strength of the supplier, and the cost of switching from one supplier to another.
- Buyer power. An assessment of how easy it is for buyers to push prices down. This is driven by the number of buyers in the market, importance of each individual buyer to the organization, and the cost to the buyer of switching from one supplier to another. A few powerful buyers are often able to dictate terms.
- Competitive rivalry. The main driver is the number and capability of competitors in the market. Competitors who offer many undifferentiated products and services will reduce market attractiveness.
- Threat of substitution. Where close substitute products exist in a market, it increases the likelihood of customers switching to alternatives in response to price increases. This reduces both the power of suppliers and the attractiveness of the market.
- Threat of new entry. Profitable markets attract new entrants, which erodes profitability. Unless incumbents have strong and durable barriers to entry such as patents, economies of scale, capital requirements or government policies, then profitability will decline to a competitive rate.
Each element of the five forces is scored 1-10 using an Excel spreadsheet template. The resulting spider chart shows where the scores rank in each of the five forces. In the example here, a single spider chart, embedded in a larger chart, shows the comparison of several innovation opportunities and how they ranked by the market compounded annual growth rate (% CAGR), projected gross margin, and individual Porter scores.
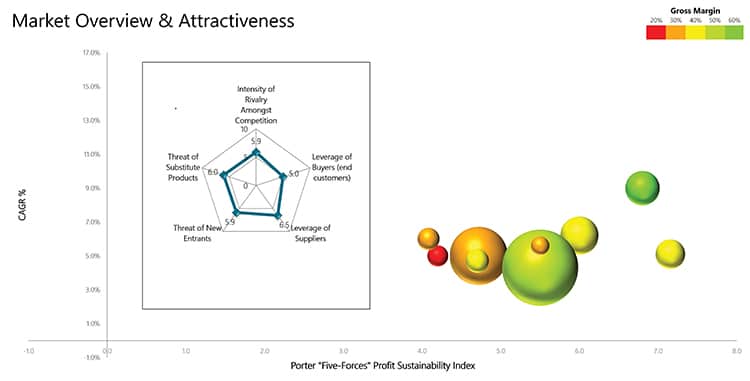 Here, the innovations highlighted in green appear to be the best opportunities for future growth. This chart is backed by several other matrices, but it clearly shows how a combination of tools, and most notably PFF, provide effective differentiation of multiple innovation opportunities.
Understanding which innovation opportunities and potential obstacles provide the highest future growth is key to making your innovation program successful. Using the PFF model at the beginning of the new product development process may help a business team learn what industry to target, which industries may give the best or least chance of success, provide an understanding of product demand, and recognize market risks.
Having a detailed grasp of multiple markets is key to making the most of this tool. Once mastered, using tools like PFF is a transparent and unambiguous way to judge which innovations may provide the best opportunity for growing your business.