
By Wenjun Wu, Dana Garcia, and Jeffrey Schneider, Arkema Inc.
Waterborne coatings are multi-component, heterogeneous systems containing a variety of additives, in addition to water, polymer binders, and pigment particles. The distribution of various ingredients in the coating films directly affects a coating’s appearance and performance; for example, optical properties, substrate adhesion, chemical resistance, and mechanical durability. Over the years, a plethora of analytical tools have been utilized in coatings characterization and defect identification. Microscopy and vibrational spectroscopy are complementary techniques and the combination of the two can provide the most complete information regarding the distributions of different coatings ingredients, as well as the fate and the impact of liquids or particulates that come into contact with the dried coating films.
This article reports new applications of two confocal microscopy techniques in coatings research: confocal Raman microscopy (CRM) and confocal laser scanning microscopy (CLSM). In a confocal microscope, most of the out-of-focus structures are suppressed at image formation. The emitted/reflected/scattered light from the sample is detected through a pinhole at the back focal plane of the microscope, enabling depth resolution and a strongly reduced background signal. As a result, confocal microscopes, compared to conventional wide-field microscopes, significantly enhance targeted analysis and image quality. The depth profiling feature of the confocal scanning microscope essentially allows optical sectioning of samples without destructive sample preparation like cross-section microtoming.
CRM combines the chemical sensitivity and specificity of vibrational spectroscopy with a high resolution confocal microscope.1 Chemical depth profiling by CRM allows for tracking of individual compounds or functional groups as a function of depth.1-9 Since Raman intensities scale linearly with concentrations, quantification of chemical species is possible by calculating the band area or the intensity ratio of the characteristic Raman transition relative to an internal reference band that retains its spatial homogeneity and temporal consistency.2-9 Combining depth profiling and lateral mapping of characteristic Raman bands of different materials, CRM has proven to be a useful research tool for spatial characterization of heterogeneous systems such as polymer blends1-2 as well as multi-component coatings based on different polymer technologies.3-9 For example, CRM has been successfully applied to investigate the degree of curing in UV-curable coatings,3,6 melamine enrichment in polyester/melamine coil coatings and its effect on mechanical properties,8 the drying process and movement of the drying front in alkyd coatings,5 the photooxidative degradation mechanism and its rate under accelerated QUV weathering conditions,6,9,10 etc.
CRM has proven to be a useful research tool for spatial characterization of heterogeneous systems such as polymer blends as well as multi-component coatings based on different polymer technologies.
The use of CRM to investigate nontransparent, especially highly pigmented coatings, has been limited because Raman transitions are relatively weak and often overpowered by the background fluorescence of many materials in the heterogeneous coating systems. Moreover, spectrum acquisition for lateral mapping and depth profiling to gain full spatial compositional distribution is time consuming. Compared to CRM, CLSM can perform real-time 3D imaging using reflection or fluorescence contrast with greatly improved speed and spatial resolution.11 Utilizing the reflection intensities, CLSM was able to reveal the distribution and orientation of platelet-shape effect pigment in a metallic automotive basecoat11,12 and to monitor blister initiation and growth in an in-situ study of the corrosion process.13
By adding a fluorescent dye molecule, color-coded fluorescence images generated by CLSM allowed the observation of water uptake over time and cavity formation during the hydration-degradation-erosion process of antifouling marine coatings.14 Similarly, CLSM has been employed to quantify the penetration depth and distribution of UV-curing fluorescent ink pigments in coated and uncoated paper.15 Because of the noninvasive nature of spatial-spectral analysis, fluorescence imaging is a rapidly growing field of the biological sciences and has found increasingly broad applications in preclinical and clinical studies.16-19 These studies also rely on the spectral signatures of either intrinsically fluorescent molecules (e.g., fluorescent proteins in tumor cells) or fluorescent markers as probes. Extensive research and successful applications have enabled real-time observation of diffusive movement of individual fluorescent molecules20 and improved the accuracy of disease detection and intrasurgical metastatic diagnosis.21 With its high sensitivity and specificity, multispectral fluorescence imaging is a powerful, noninvasive method that can be employed to monitor treatment responses22 and even to guide neurosurgeries.23 Much can be learned and leveraged from other scientific fields to promote the development and application of CLSM techniques for coatings research.
In this article, CRM and CLSM are employed to analyze some common coatings phenomena such as component distribution, surfactant leaching, stain penetration, and removal. The applicability and benefits of these two confocal techniques in coatings research will be demonstrated by three examples. The spatial distribution of a styrenated additive (SA) and surface enrichment of a polymerization surfactant in pigmented acrylic paints are characterized by CRM. Utilizing the intrinsically fluorescent color compounds present in grape juice, CLSM was explored to directly visualize and quantify stain penetration. The fluorescence emission from grape juice, a normally undesired interference for Raman spectroscopy, was utilized to semi-quantitatively characterize stain penetration and stain removal. This article also describes the data analysis techniques developed in these studies to effectively compensate for the weak Raman signals and therefore expand the use of CRM for quantitative and semi-quantitative analyses.
Experimental
Materials
Latex and Paint Samples
The acrylic emulsion polymers AP1 and AP2 were prepared by semi-continuous emulsion polymerization of butyl acrylate, methyl methacrylate, methacrylic acid, and N-(2-methacryloyloxyethyl) ethylene urea. A C14–C16 alphaolefin sulfonate was used as the polymerization surfactant at 0.72 parts based on total monomers (BOTM) to emulsify the monomer mixture and to stabilize the resulting latex particles. The glass transition temperatures (Tg) of both acrylic polymers were 0°C as measured by differential scanning calorimetry (DSC). The SA was an ammonium-neutralized solution of poly(styrene/a-methylstyrene/acrylic acid) terpolymer. The SA has a number-averaged molecular weight of 6500 and an acid number of 205. Its Tg was determined by DSC to be 110°C.
The acrylic polymers were formulated into low-VOC coatings using the same formulation [35% volume solids (VS) and 31% pigment volume concentration (PVC)] described in a previous publication.2 The corresponding paint samples were utilized in the three case studies and denoted as Paint I-SA (based on blend of AP1 and SA), Paint I (based on latex AP1), and Paint II (based on latex AP2).
Fluorescence of Concord Grape Juice
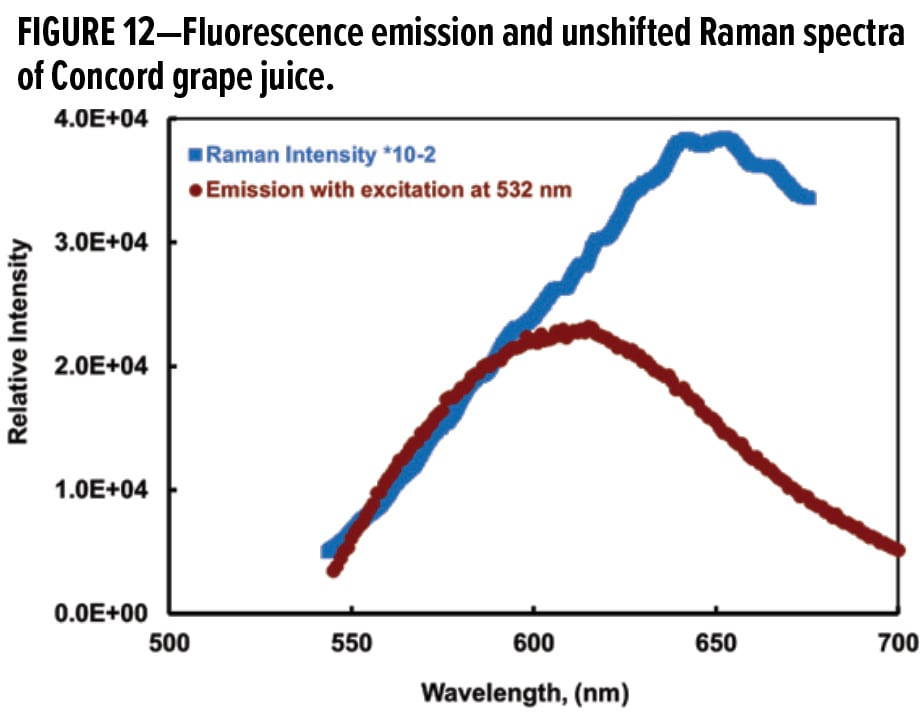
The staining liquid, Welch’s Concord grape juice, was purchased from grocery stores. Fluorescence absorption and emission spectra of the diluted grape juice in water were collected on an FLS980 Spectrometer (Edinburgh Instruments) in the Laboratory for Imaging and Kinetic Spectroscopy at North Carolina State University. Absorption was scanned from 200 to 800 nm. The emission spectrum was generated with an excitation wavelength at 532 nm.
Confocal Raman Microscopy
The paint films for CRM measurements were prepared on Leneta white panels using a 7-mil drawdown bar and dried at 25°C and 50% relative humidity (RH) for seven days. Confocal Raman investigation of paint films was conducted on an Almega™ Raman system (ThermoFisher Scientific). The Almega Raman utilized the 532 nm laser (Nd:YVO4 frequency doubled) with a power of ~25 mW. Spectra were collected from 64 exposures at 1 second each using a 50X long working distance (LWD) objective. Multiple measurements were made for both lateral and depth scans to ensure reproducibility. Depth profiling started from the surface of the film with two-micron step change. To ensure experimental consistency, the zero-depth position was determined under the objective of the Raman microscope. The sample stage was raised until the topographical features of the sample were in optical focus with reflected light and then the C–H stretching Raman transition was maximized using the 532 nm laser source. This position was defined as the origin (film surface) and the depth was determined from the stage Z direction micrometer.
Confocal Laser Scanning Microscope Techniques
The spatial imaging capability of CLSM was explored for rapid confirmation as to whether grape juice’s fluorescence can be utilized to detect penetration of grape juice into polymer and paint films. The CLSM experiments were performed using the Nikon A1 multispectral fluorescence microscope in the imaging center on the St. Paul campus of the University of Minnesota. Nikon A1si is a confocal system equipped with a point-scan scan head and mounted on a Nikon Ti2000E inverted, fluorescence microscope with DIC optics. A 560 nm laser at 40 mW was used in the fluorescence imaging and the NIS Elements imaging software was used to control data acquisition and analysis.
Stain Resistance and Washability
Sample preparation and testing conditions were described in a previous paper.24 The paint films were prepared on the Leneta white or black scrub test panels using a 7-mil DOW bar and allowed to dry at 25°C and 50% RH for a minimum of three days. Common household stains including mustard, ketchup, hot coffee, grape juice, wine, and blue fountain ink, were tested. For liquid stains like grape juice, a strip of single-ply paper towel was used to hold the liquid stains in place. The residence time of the stain (staining time) in this study varied from 20 min to 24 h to span the range of MPI cleansability and ASTM washability tests. The stained panels were rinsed under running tap water, and excess stains were gently removed by a soft brush before a sponge wash for 100 cycles with water or other alkaline cleaning solutions (e.g, Formula 409®, Leneta standardized nonabrasive scrub medium). The Garner Straight Line Washability and Wear Abrasion Machine was used for the washability test.
Stain resistance can be visually assessed by comparing the water rinse section before and after staining and water rinse. The degree of staining was determined using the ΔE values measured by a BYK-Gardner colorimeter of unstained vs stained and washed portions of the paint film. For each sample, two paint drawdowns were prepared on the same Leneta chart to ensure that drying, staining, and washing conditions were the same, and duplicated color measurements and CRM experiments were recorded.
Results and Discussion
CRM is an effective method for quantifying the distribution of individual constituents in heterogeneous systems based on the unique Raman spectra of different materials.1-9 The first two examples discussed in this article illustrate that CRM can be employed to map relative spatial locations of various chemical species even in pigmented, multi-component coating systems. The methods described in this article can be applied to characterize component interactions and distributions in various polymer blends as well as other additives present in paint formulations. Problems such as material stratification, segregation, or migration across interfaces due to formulation instability or material incompatibility can thus be identified and addressed.
Example 1: Spatial Distribution of Styrenated Additive in Acrylic Paint Films
The effects of an alkali soluble resin on the morphology and mechanical properties of neat latex films have been reported previously.2 CRM was employed to quantify the distribution of the SA within the polymer films. Since the acrylic polymer contained no aromatic moieties, quantitative analysis was done by comparing the intensities of Raman transitions associated with phenyl rings (Iph) on the additive to that of carbonyl groups (IC=O) of the acrylic polymer. The Raman intensity ratios confirm a uniform spatial distribution of the SA throughout the latex film.2 The previous CRM investigation was performed on the clear latex films containing 10% and 20% SA. The SA concentration was 2.0% in the paint formulation, equivalent to 3.7% based on paint solids. The same quantification approach (Iph/IC=O) was applied in this study to investigate SA distribution in the pigmented paint films.
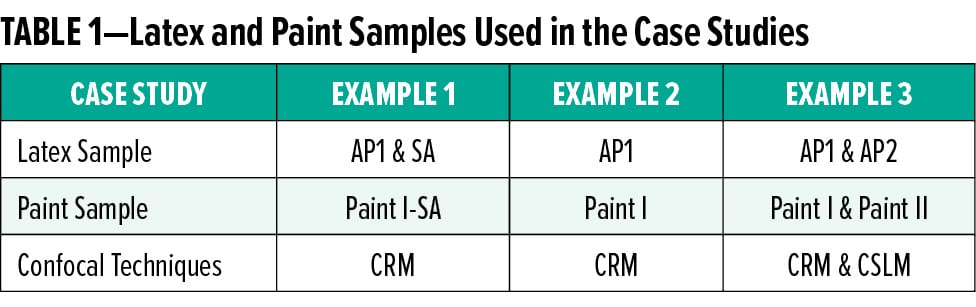
Figure 1 shows the Raman spectra with depth increments of 10 microns (top red trace) up to 50 microns (bottom blue trace) into the film of Paint I-SA. The presence of rutile titanium dioxide (TiO2) is clearly seen from the Raman spectra. The Ti-O stretching and bending transitions are in the spectral range of 650 to 100 cm-1.25 All spectral intensities decrease progressively due to depth attenuation as CRM probes deeper into the nontransparent paint film. Contrasted with the latex films, the depth attenuation is dramatic for the TiO2-containing paint samples owing to film opacity.
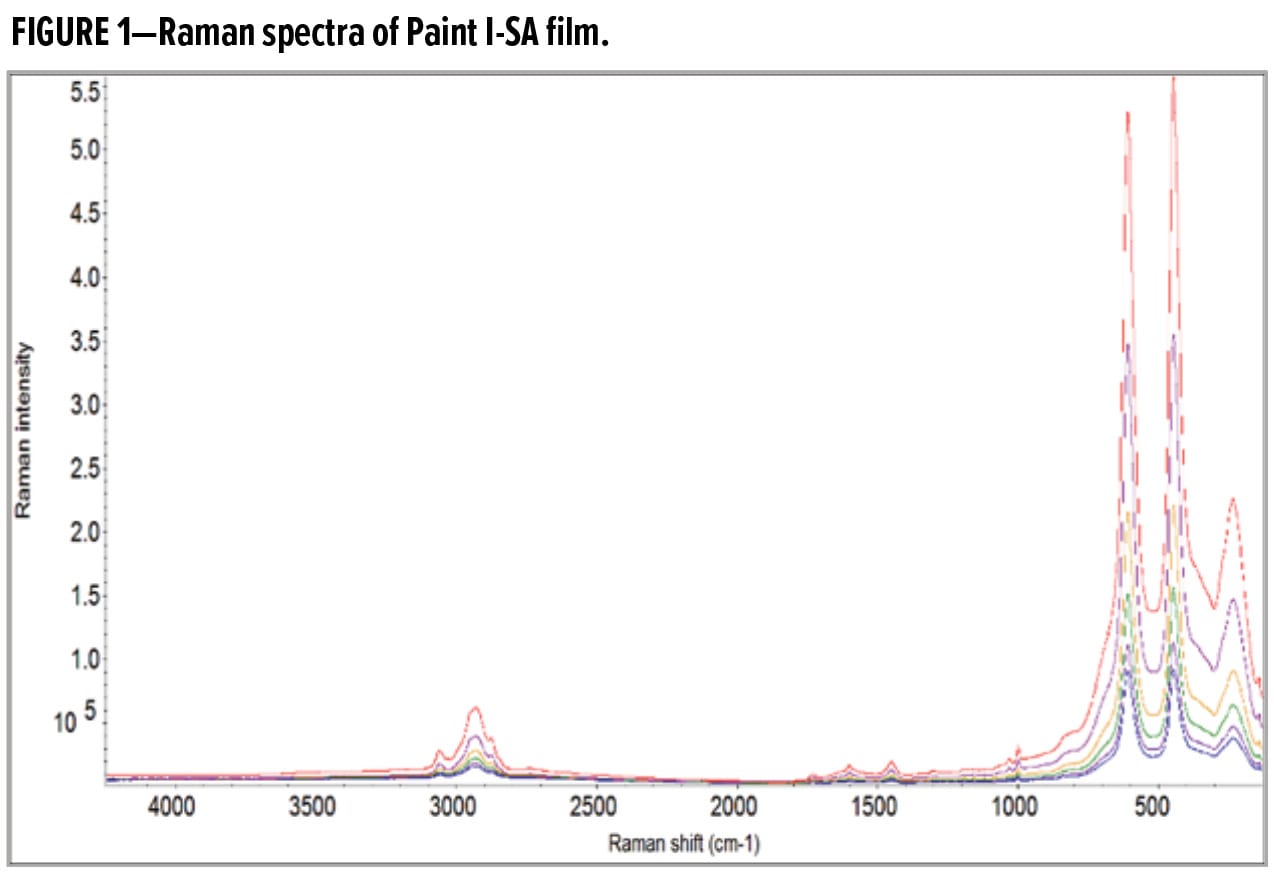
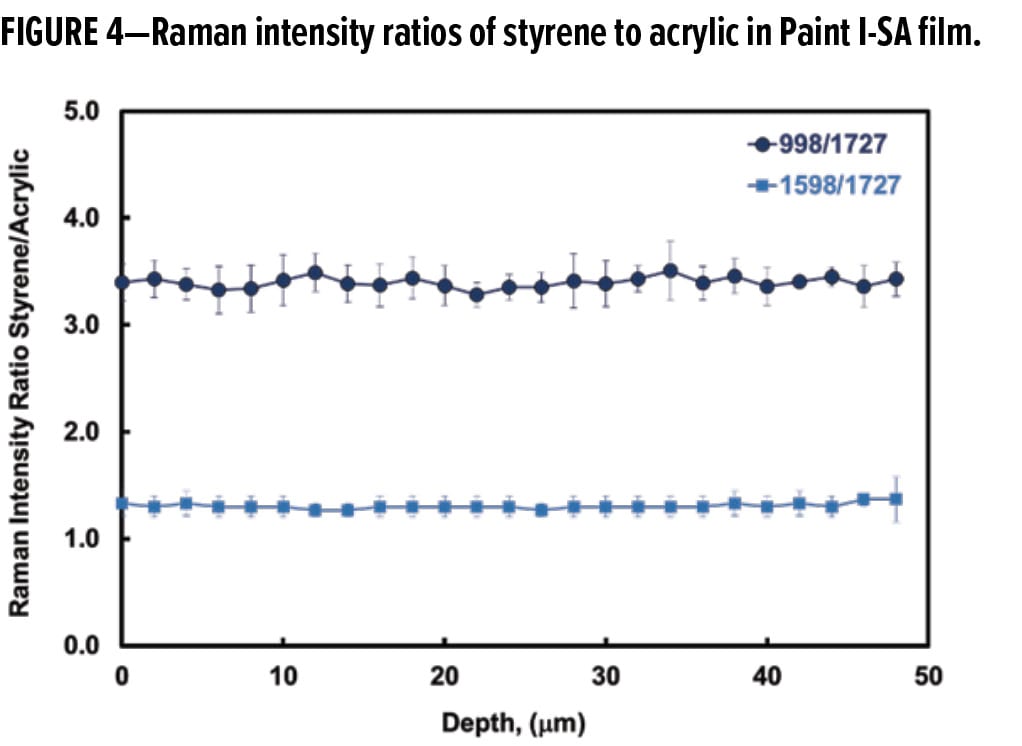
Fortunately, the strong Raman transitions of TiO2 at low wavenumbers do not impede the analysis of other spectral features belonging to the acrylic polymer and the SA. Figure 2 displays the Raman spectra of interest from 4000 to 800 cm-1 for the Paint I-SA film. The Raman transitions indicating the presence of the SA component are marked in Figure 2: aromatic C–H bending and ring breathing at 998 cm-1, aromatic ring motion at 1598 cm-1, and aromatic C–H stretching at 3060 cm-1. The intensity ratios of styrene to acrylic signature bands at various depths were employed for quantification of SA concentration, so that the influence of signal attenuation was minimized.
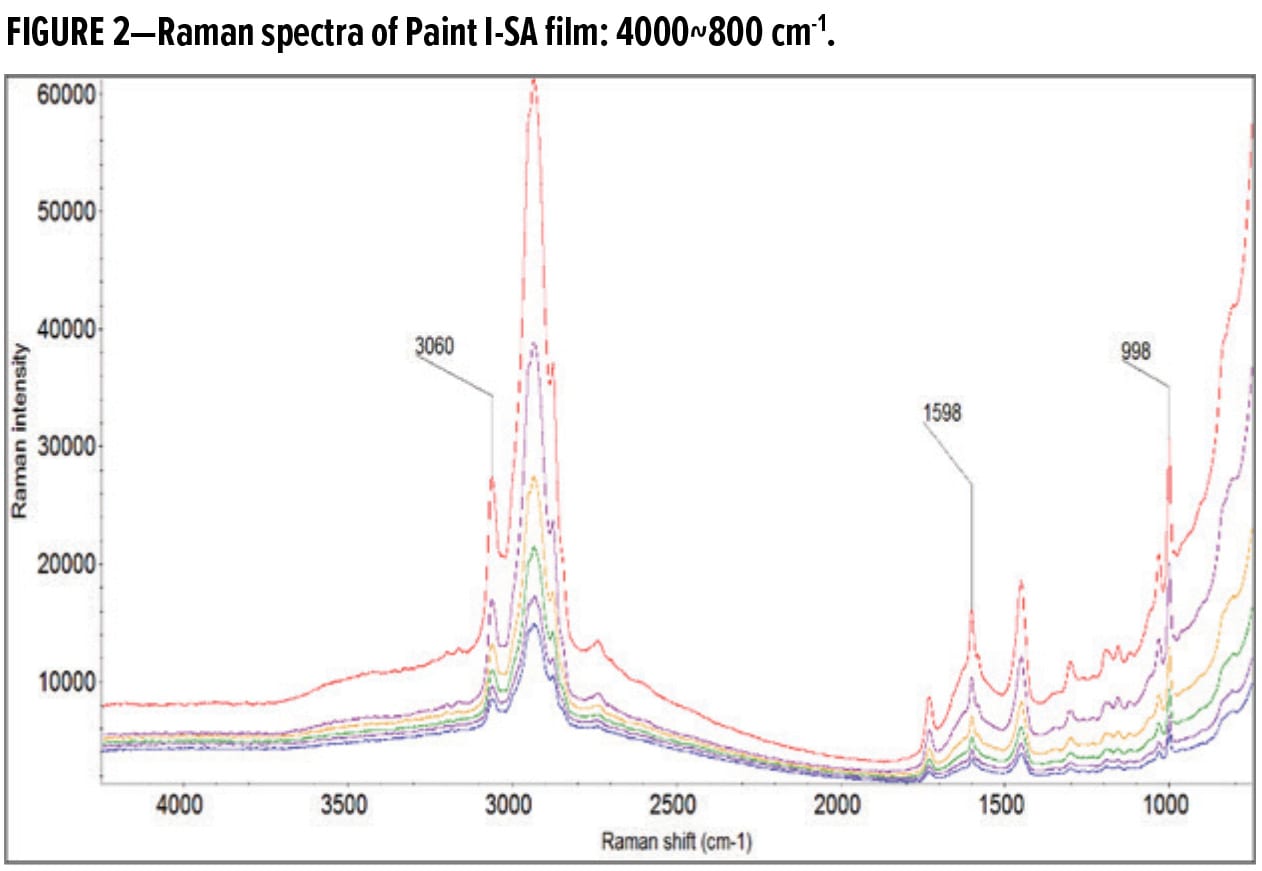
Figure 3 shows the Raman intensities of TiO2 and the styrene transition at 998 cm-1 as a function of depth in Paint I-SA film. The intensity of the styrene peak at 998 cm-1 is weaker than TiO2; thus, a multiplication factor of 20 is used to display the styrene signals on the same graph with TiO2. Figure 3 demonstrates that the depth signal attenuation is similar for TiO2 and the styrene component, indicating a uniform SA distribution across the film thickness.
The distribution of the SA in the paint film was quantified by comparing the styrene peaks at either 998 cm-1 or 1598 cm-1 to the C=O peak at 1727 cm-1 representing the acrylic polymer. Figure 4 displays the Raman intensity ratios of both styrene transitions to the carbonyl stretching band. The intensity of the 998 cm-1 transition is greater than that of the 1598 cm-1 transition, its styrene to acrylic peak intensity ratio Iph/IC=O is therefore higher, consistent with the spectral features shown in Figure 2. Nevertheless, the two sets of data in Figure 4 show little variation as a function of film depth and both lead to the same conclusion, i.e., the SA concentration, proportional to the intensity ratio, remains unchanged across the thickness of the paint film. Figure 4 represents the averaged intensity ratios from three run profiles at different sample locations. The small error bars displayed in the graph demonstrate reasonably constant lateral concentrations of SA as well as good reproducibility of the Raman depth profiling. The results further support the conclusion that the SA is uniformly (i.e., a constant concentration profile) distributed in the pigmented paint films. The CRM experiments yielded an excellent agreement with the previous finding regarding uniform distribution of the styrene additive in the neat latex films.2
Example 2: Surfactant Enrichment on Paint Film Surface
Quantification by standard peak-fitting or intensity ratio requires a “clean” Raman spectrum and strong material-specific Raman bands, as exemplified by the CRM analysis of SA distribution. Difficulties often arise in CRM analysis because of sample fluorescence, baseline shifts, and/or overlapping peaks. A smoothed second-derivative processing approach has been shown to provide an alternative quantification procedure.26 The second derivative sharpens those subtle features that are difficult to quantify in the original spectra and therefore overcomes some of the above-mentioned problems. The example below demonstrates the advantage of this data analysis strategy.
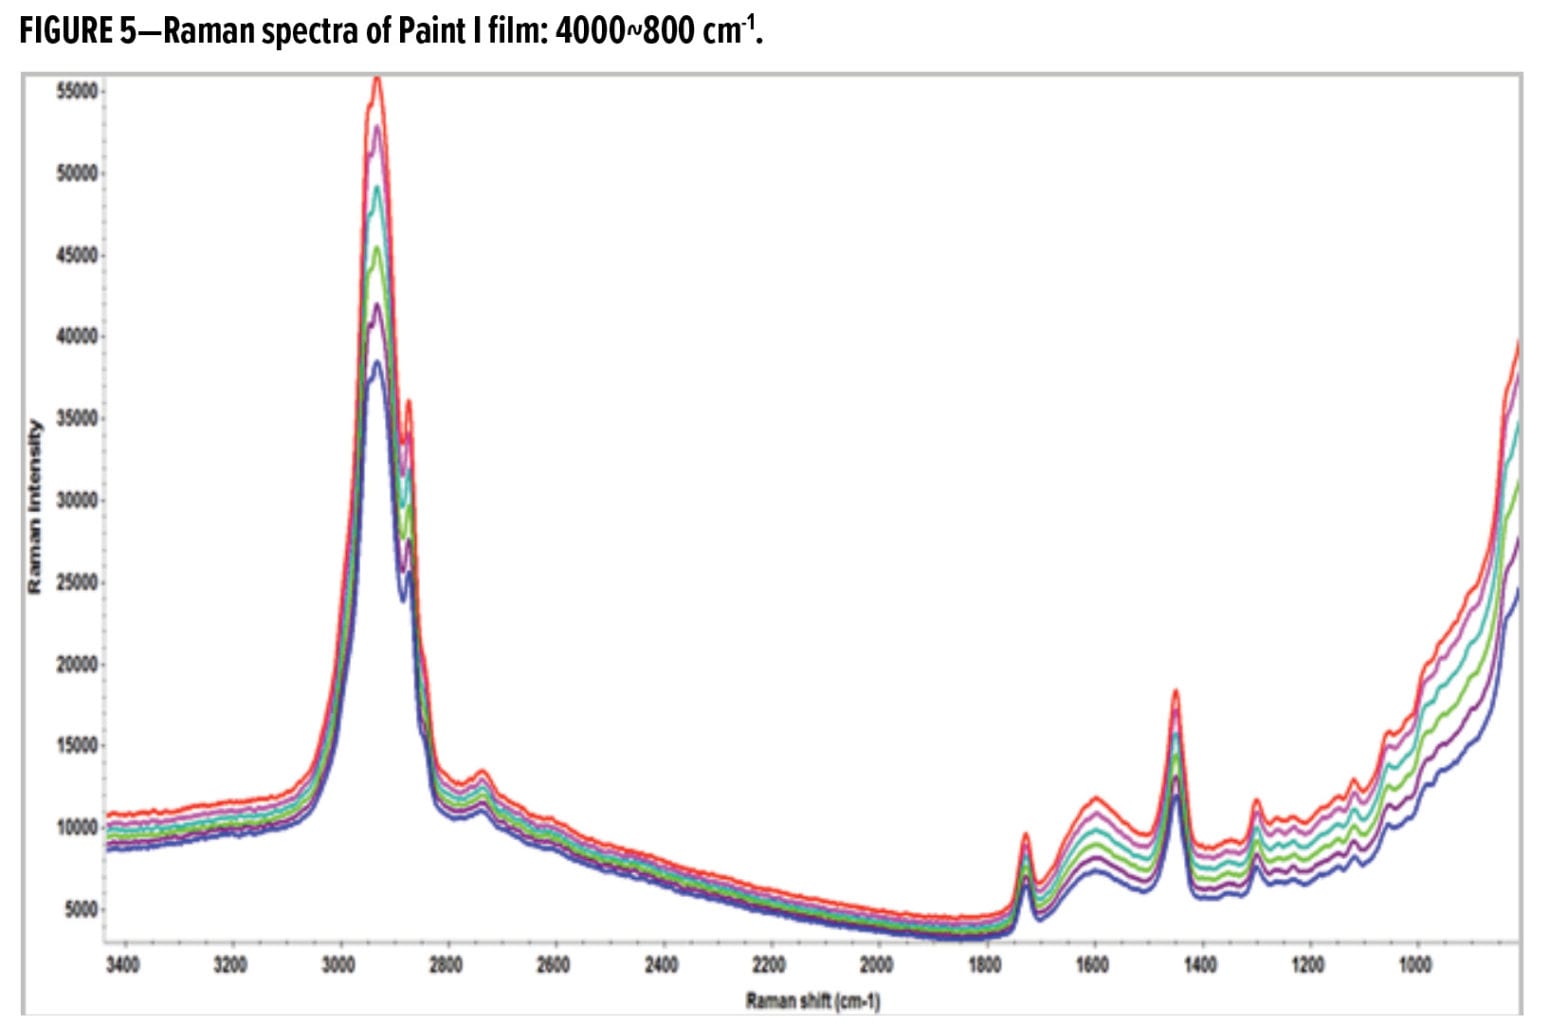
The Raman spectra of the Paint I film from the air-film interface (red trace) down to 50 microns (blue trace) are displayed in Figure 5. The Paint I film exhibits compositional inhomogeneity in the first eight microns of the surface, but the spectral differences are small and can be better discerned in the second derivatives of the Raman spectra. Figure 6a shows the second derivatives of Raman spectra in the C–H regions (3000~2800 cm-1) for the surface of Paint I film. The transitions between 2920 and 2925 cm-1 correspond to the C–H stretching of methylene linkage –(CH2)n– in long chain hydrocarbon structures. The red trace represents surface (0–4 mm) and the green trace represents depth (4–8 mm). Higher absolute y-axis values in Figure 6 indicate higher Raman intensities in this spectral region (the negative sign is a result of the derivative calculation).
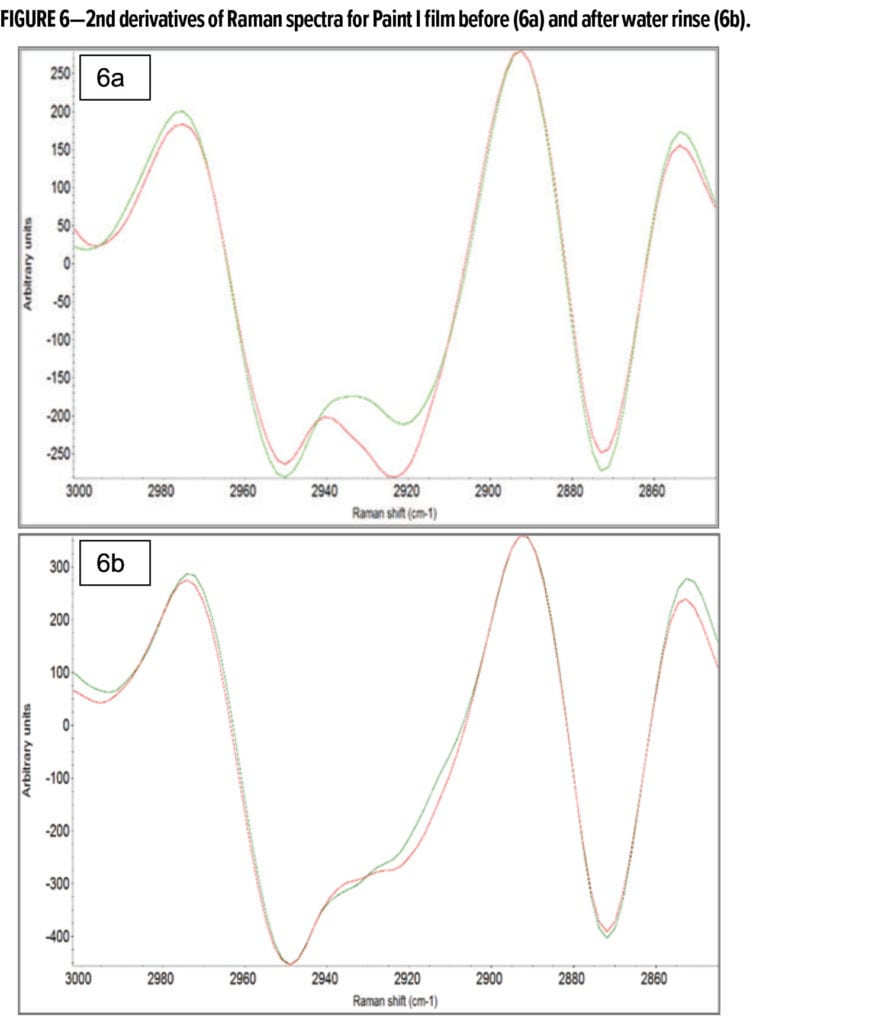
The differences in Figure 6a thus indicate that a compound rich in aliphatic hydrocarbon units resides in the top four microns of the Paint I film, presumably the C14–C16 alpha-olefin sulfonate surfactant used in the polymerization of the acrylic latex (AP1). Figure 6b displays the second derivatives of Raman spectra for the surface of the Paint I film after water rinse. The second derivatives of Raman intensities are now much more similar and the difference across film depth is no longer detected. This suggests that a simple rinse of the top surface with water is all that is required to eliminate most of the surface compositional inhomogeneity found in the top eight microns of the Paint I film. The small spectral changes in band shapes are likely a consequence of the rinse process as the fine surface topography may have been altered.
Surfactant leaching is an issue frequently encountered with exterior waterborne paints, especially in high humidity environments. Aside from the unsightly “snail trail” on the paint surface, a nonuniform surfactant distribution caused by surfactant migration can lead to other performance problems like blister formation and adhesion failures. Surface enrichment of surfactants has been reported for many latex films involving different nonionic and anionic surfactants used in synthesis of emulsion polymers.27-34 In paint formulations, the concentration of polymerization surfactant is significantly reduced. The C14–C16 alpha-olefin sulfonate surfactant was used at 0.72% based on total monomer in the synthesis of AP1. Its concentration in the liquid paint sample was 0.15 wt% (concentration in water ~0.32 wt%), which is still 2~5 times higher than its critical micelle concentration (cmc) of 0.07 wt%. This example demonstrates that the sensitivity of CRM allows for detection of migration and surface enrichment of low concentration species like polymerization surfactant on the paint film surface.
Example 3: Characterization of Stain Resistance, Stain Penetration, and Stain Removal
Stain resistance, and easy and clean stain removal are desirable properties of interior wall paints and a key performance category that the Consumer Reports® tests and ranks for interior paint products.35 Stain resistance is the ability of a coating surface to withstand discoloration caused by contact with liquids and solid particulates. A washability test assesses the relative ease and completeness of removal of a specific soilant from a coating surface by scrubbing. The qualitative generalization was made in a previous study that good washability usually corresponds well to high resistance to the water-based household stains.24 Two confocal scanning microscopy techniques, CRM and CLSM, are explored in this study to characterize washability or stain removal in relation to stain resistance and stain penetration of polymer binders as well as the effect of staining time and washing protocols.
Selection of Representative Staining Material and Paint Samples
Welch’s Concord grape juice was used to probe stain adsorption and penetration. It was chosen as the surrogate staining agent in this study because 1) it is a common food stain and some of the color-contributing chemicals in grape juice are also responsible for the color, flavor, and aroma of red wine.36 Consequently, any finding from grape juice is expected to correlate with red wine, another liquid stain often specified in the paint washability test; and 2) the colors of other food stains such as mustard, coffee, and tea are also attributable to phenolic compounds. The spectroscopy and microscopy methods developed for grape juice are likely to be applicable to those food and beverage stains that have their own specific absorption and emission spectra.
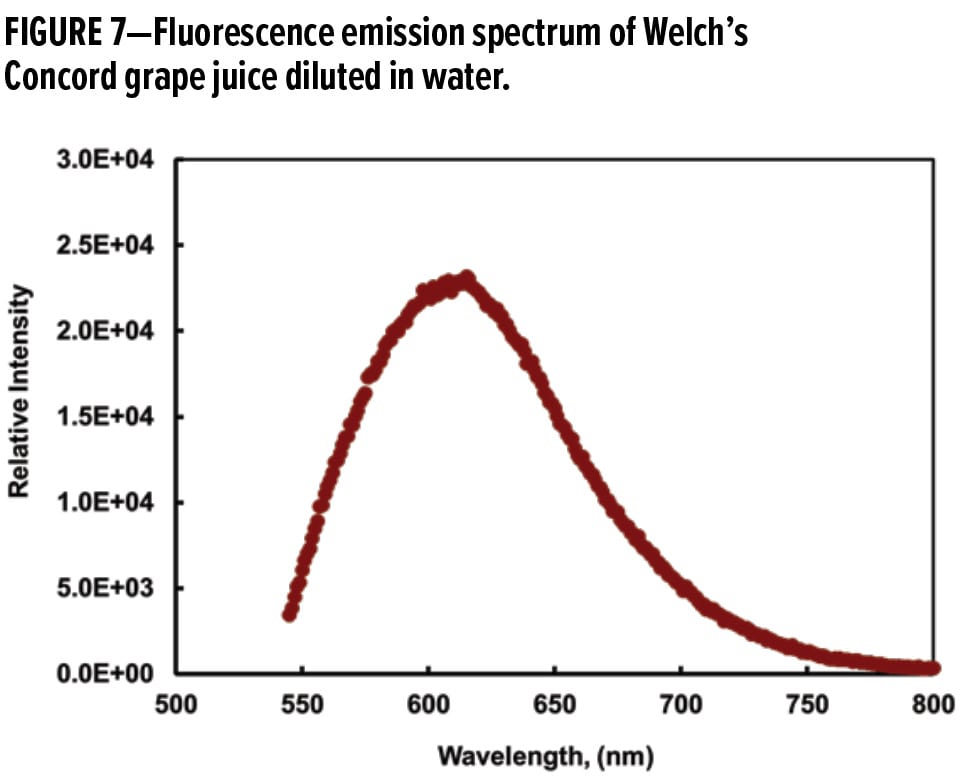
The intense color of Concord grape juice has been attributed principally to the presence of anthocyanins, which are water-soluble fluorescent pigments.37 Figure 7 displays the emission spectrum with excitation at 532 nm for Welch’s Concord grape juice diluted in deionized water. The emission spectrum of the juice was recorded from 545 to 800 nm since fluorescence is expected to be lower energy emissions at longer wavelengths than the excitation wavelength. The 532 nm excitation wavelength was chosen to match the laser wavelength of the Almega Raman system. This wavelength selection will be discussed in the section on “Characterization of Stain Adsorption, Penetration, and Removal Using CRM” later in this article.
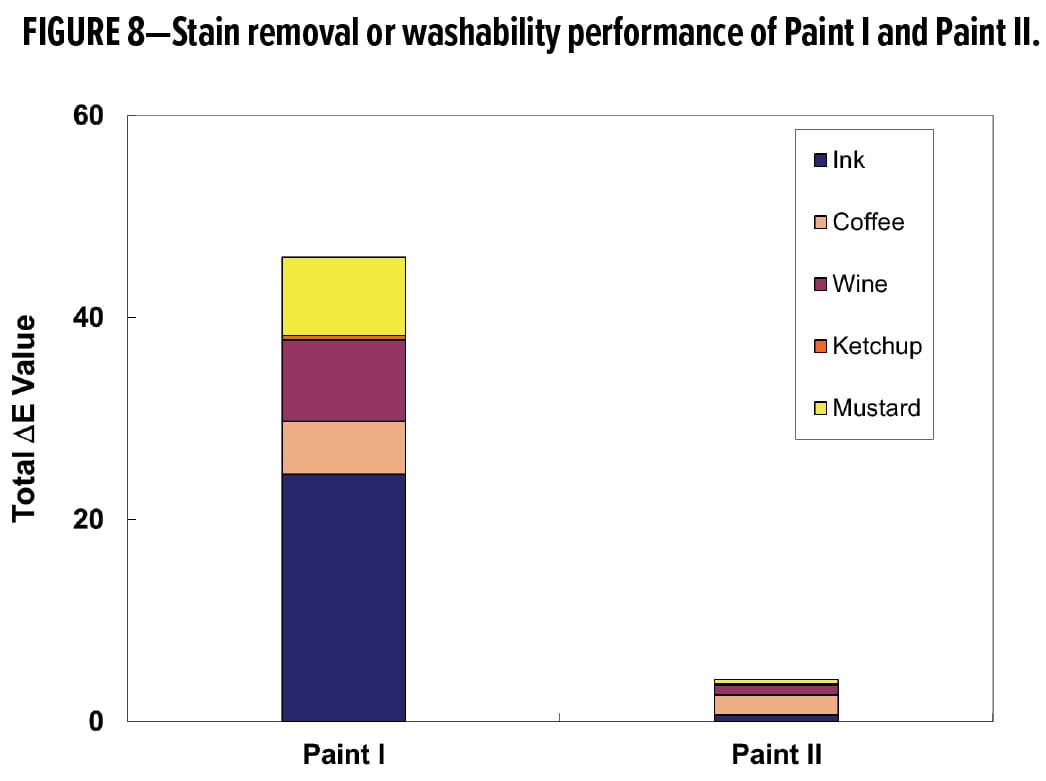
For a given stain, stain resistance and washability are affected by the composition, surface characteristics, and porosity of the paint film. Depending on the binder choice and the paint formulation strategy, stain resistance and washability of the resulting coating can vary greatly. Residual color from each stain is typically measured as color change, DE. Small DE values are thus desirable, denoting slight or no staining of the paint surface. Figure 8 plots the total DE values of Paint I and Paint II surfaces after the 5-stain washability test. Paint I and Paint II are based on the two acrylic latexes, AP1 and AP2, in the same paint formulation. Figure 8 illustrates vividly the influence of binder choice, highlighting that AP2 drastically improves removal of the five stains investigated. Therefore, Paint I and Paint II with strikingly different stain resistance and washability performance, are ideal samples that can be used to provide contrast and validation for the observations by confocal scanning microscopy techniques.
Visualization and Quantification of Stain Penetration Using CLSM
Since the presence of fluorescent substances in the grape juice stain has been confirmed (Figure 7), the fluorescence imaging capability of CLSM can be employed for visualization and quantification of juice penetration into coating films. For simplicity of the feasibility check, grape juice was applied to the clear polymer films via a strip of single-ply paper towel and let stand for two hours. A quick screening of the stained AP2 film produced promising results: the color-coded spectral images of the grape juice and acrylic polymers are pink and blue, respectively (Figure 9). This distinct microscopic contrast is encouraging and can be utilized to provide spatial differentiation for the grape juice stain in the polymer matrix. Visualization and quantification of grape juice penetration depth is made possible.
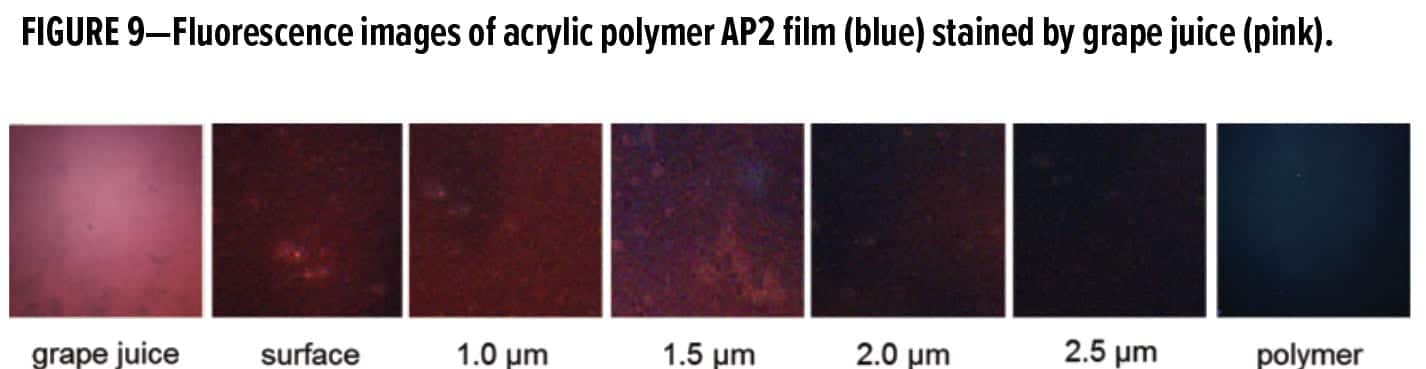
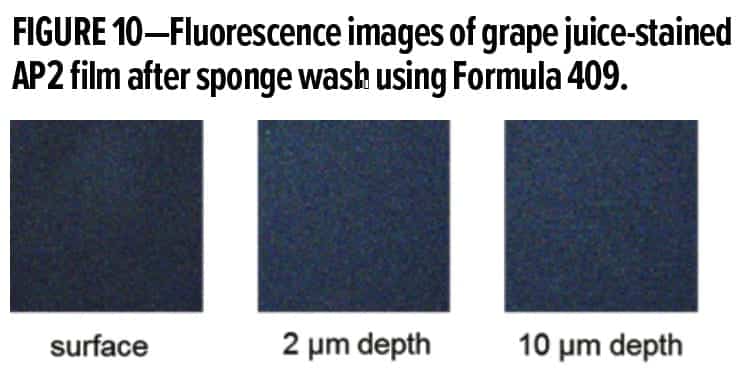
The benefit of fluorescence imaging and depth profiling is fully illustrated in Figure 9 which depicts layer-by-layer optical sectioning of the stained latex film. The pink color indicating the presence of grape juice was found at the film surface and the first two microns under the surface. Figure 10 shows the CLSM images of the stained polymer film after the sponge wash using Formula 409, a common all-purpose household cleaner. The pink color of grape juice was no longer visible even on the surface image. Figure 10 suggests relatively shallow penetration of grape juice into the well-coalesced film of the low Tg polymer. After cleaning with Formula 409, the grape juice stain was completely removed from the polymer film surface.
Using this CLSM technique, red wine and coffee were found to also produce colored spectral images distinguishable from the acrylic polymer matrix, confirming the utility of this powerful tool for visualizing a wide range of staining materials. This is the first reported application of CLSM for direct visualization of spatial distribution and penetration of soilants or stains in coating systems. The meaningful extension of this technique to the pigmented paint samples met a few challenges. Our preliminary investigation indicated that higher laser powers were required because the intensity of fluorescence was reduced in the opaque paint films, but the staining materials decayed rapidly under these conditions. Quantitative measurement and visual display of grape juice penetration into latex films and clean stain removal afterwards demonstrate the usefulness and advantage of fluorescence imaging, which hopefully will encourage more research efforts to advance the method development for more complex coating systems.
Characterization of Stain Adsorption, Penetration and Removal Using CRM
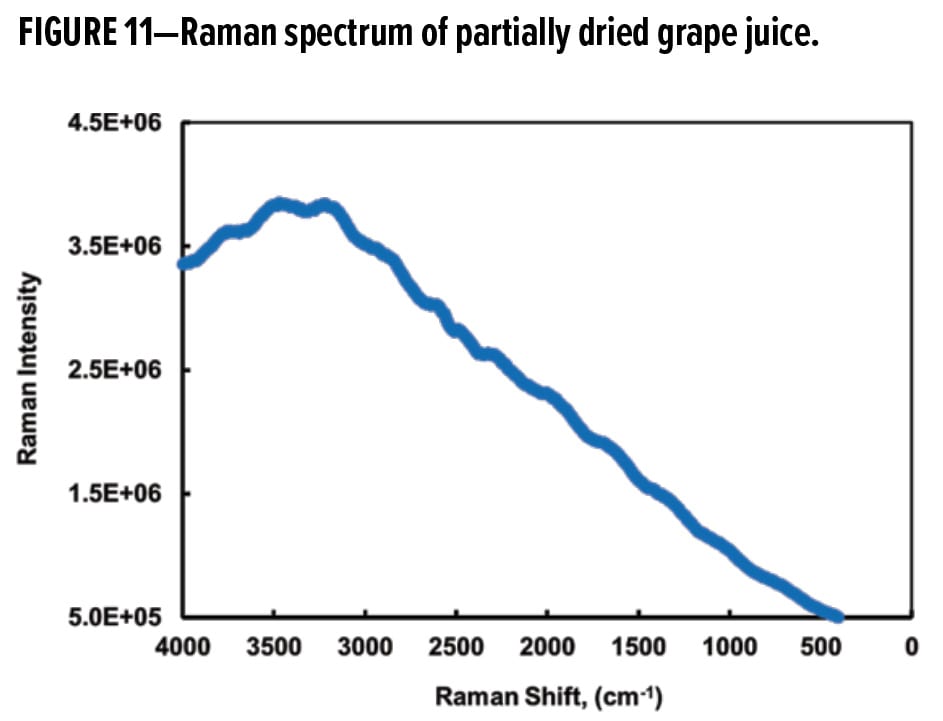
In this study, the initial objective was to determine whether a grape juice-specific Raman transition can be found and utilized. Figure 11 shows the Raman shifted spectrum of partially dried grape juice. Not surprisingly, strong fluorescence dominated the spectrum and no specific Raman transitions were detected on the fluorescence envelope. This interpretation is corroborated by the emission spectrum in Figure 7.
The principle of Raman spectroscopy is based on the inelastic scattering of monochromatic light when the frequency of photons changes upon interaction with a sample. The frequency of reemitted photons from the sample is shifted in comparison with the original monochromatic frequency, which is known as the Raman Effect. This energy shift is characteristic for the type and coordination of the molecules involved in the scattering process and, therefore, provides information about vibrational and rotational energies of molecular bonds.
Figure 12 compares the unshifted Raman spectrum with the emission spectrum from grape juice using 532 nm excitation. The Raman excitation laser is also at 532 nm, which allows the unshifted Raman spectrum to be recalculated from the Raman shifted spectrum (Figure 11) and the excitation wavelength at 532 nm. The two spectra in Figure 12 are similar in overall shape. The observed shift in the maximum is possibly a consequence of recording the fluorescence in a partially dried state for the Raman experiment and in water for the emission spectrum. One way to minimize the fluorescence is to use a longer wavelength laser; the drawbacks, however, would be lower Raman intensity. It will be difficult with a lower energy laser to resolve the low surface concentration effect of color bodies in the grape juice.
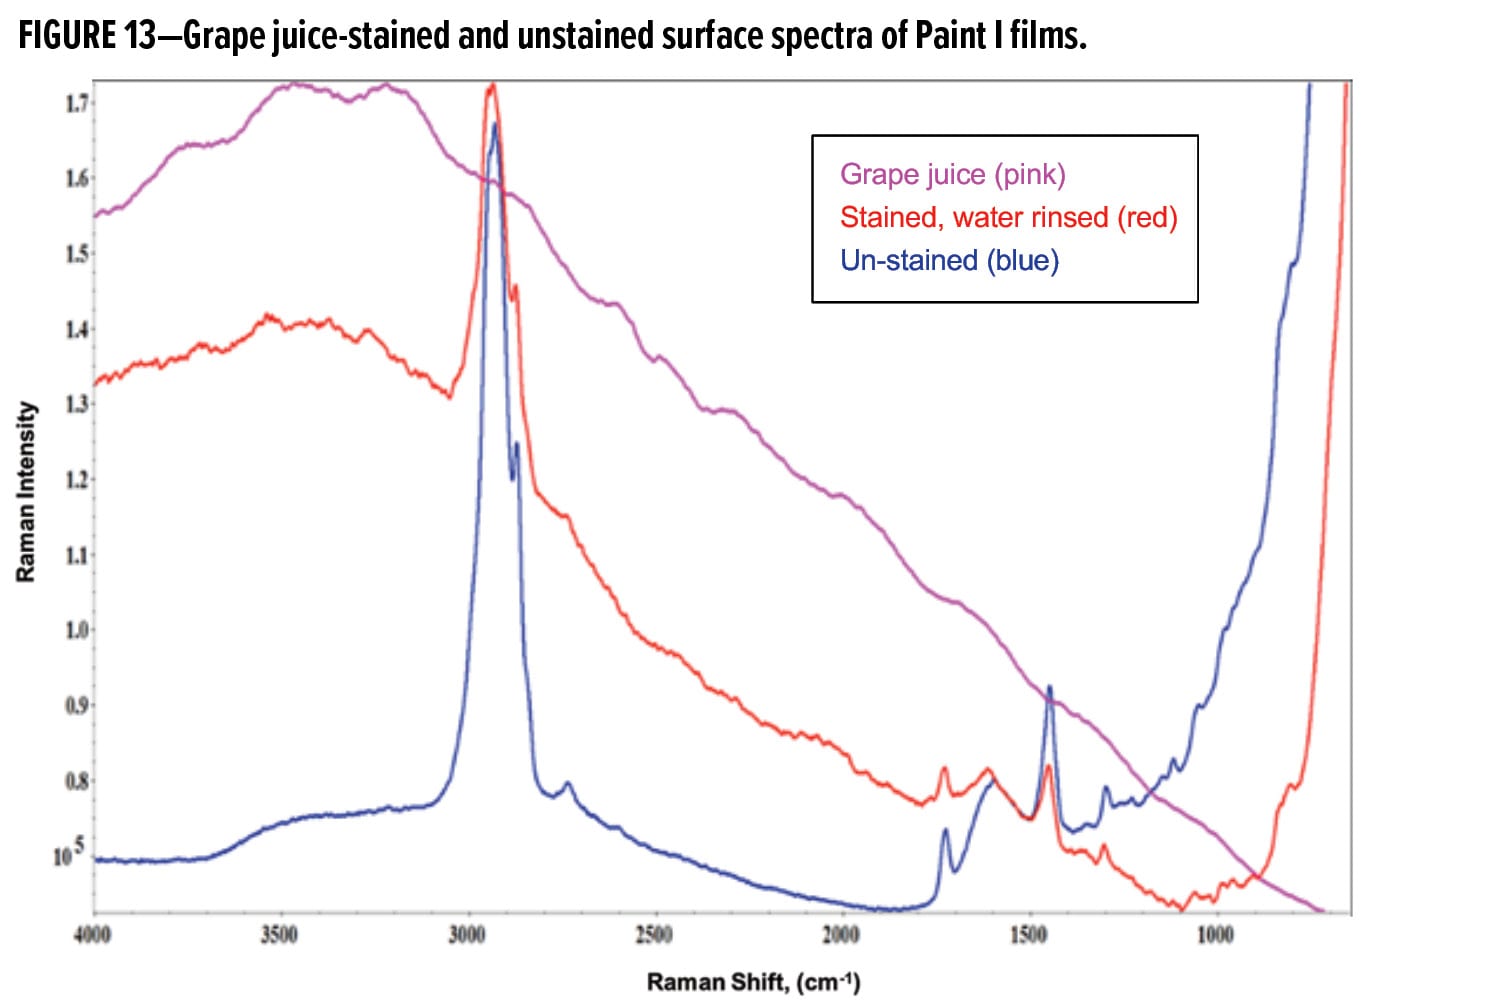
The fluorescence envelope was also observed for Paint I and Paint II samples stained with grape juice. Figure 13 displays exemplary Raman spectra taken on the film surface of Paint I. A “hump” between 4146~3071 cm-1 was present in the spectra of the stained and water-rinsed paint films, consistent with the Raman spectrum of the dried grape juice in the same spectral range. This region of the fluorescence envelope is denoted as “high frequency curvature.”
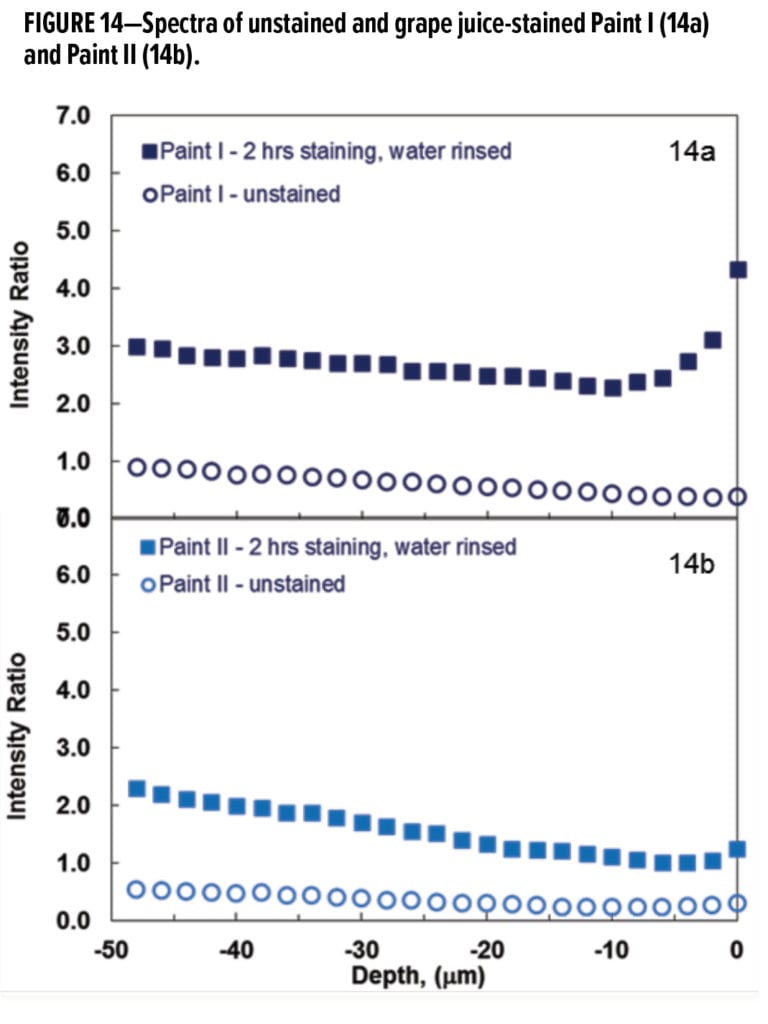
With no juice-specific Raman peaks, a novel data analysis methodology was developed to exploit the fluorescence envelope in the “high frequency curvature” region. Semi-quantitative analysis of grape juice concentration and penetration depth was performed by normalizing the area under the curvature 4146~3071 cm-1 to the area of C–H stretching transition between 3075~2798 cm-1 to account for experimental variables. This intensity ratio signifies the concentration of grape juice. The results from depth profiling of the unstained and the stained samples of the two paints are presented in Figure 14. The intensity ratios of both unstained samples, as expected, are relatively constant. After two hours of contact with grape juice followed by a gentle water rinse, the samples displayed an intensity attenuation for the top surface layers. The minimum in the depth profile plot was taken as the end point of grape juice penetration.
The difference in the surface concentration of grape juice between the two paint films was supported by the extent of discoloration. Figure 15 provides photos of two stained and water-rinsed paint panels along with the measured color change or DE due to grape juice staining. It is clear from the visual comparison of the two photos and the measured DE values that Paint II has greater stain resistance and better washability than Paint I. A highly stain-resistant coating surface is more difficult for stains to adhere to and allows easier removal of any residual stain during washing cycles. For Paint II, a simple water rinse removed most of the stains, suggesting that the adhesion and adsorption of grape juice on the paint surface is weak and the stain penetration is minimal.
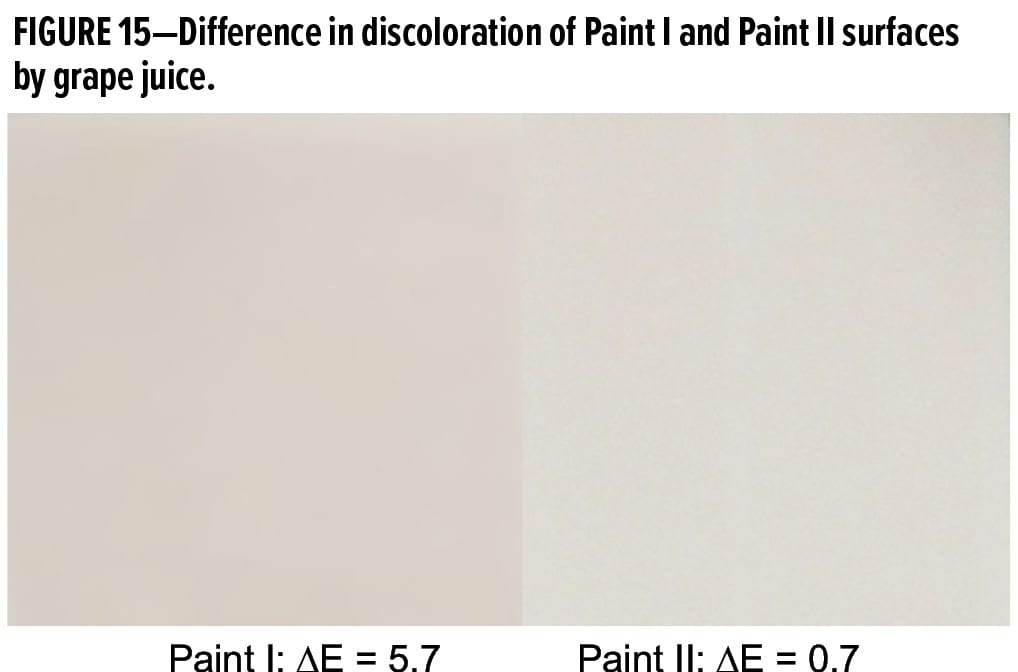
Figure 16 illustrates the effects of grape juice staining time on Paint I and Paint II films. In both cases, the intensity ratio of the high frequency curvature area to the C–H stretching area increases with increasing stain residence time. Figure 16a shows that longer staining time leads to a higher surface concentration of the color compounds left by grape juice. A large upward shift is seen when the staining time changes from 20 min to two hours. Beyond two hours, the shifts become smaller with further increase of staining time. Compared to Paint I, a smaller change in surface concentration and penetration distance was observed for Paint II. This indicates that the impact of longer staining time was reduced in a more stain-resistant coating system.
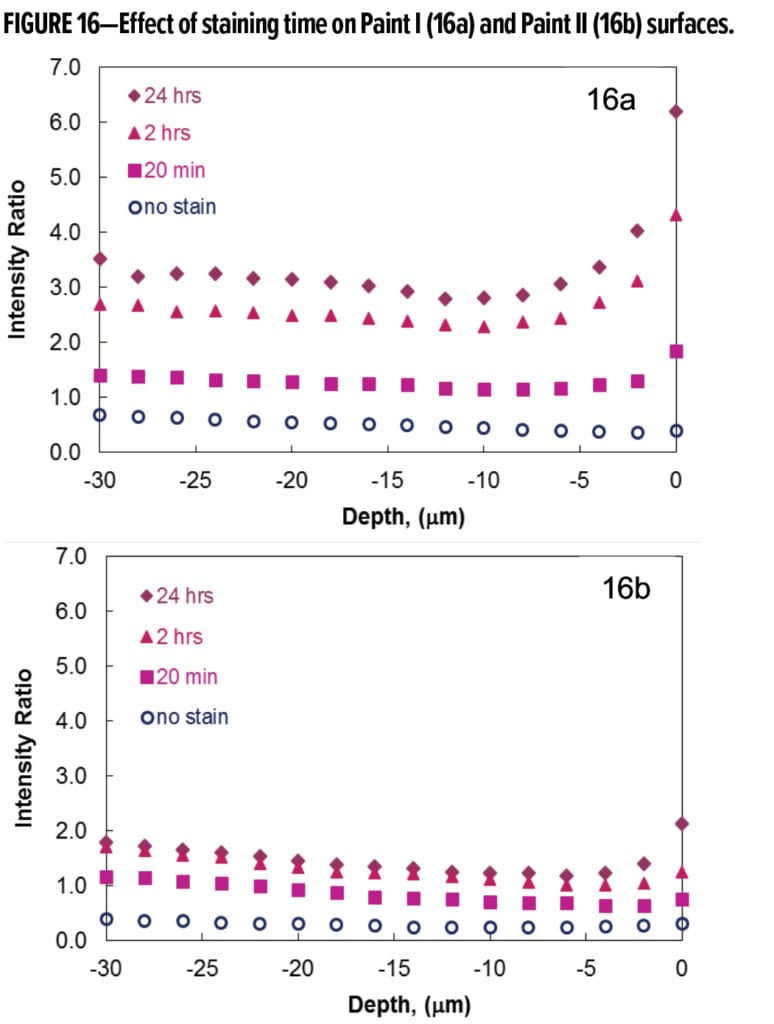
Besides higher surface concentration, the grape juice stain was also detected at increased depth in Paint I with longer staining time. For Paint I (Figure 16a), the penetration depth was 6~8 microns after staining for 20 min. When grape juice was left on the paint films for two hours or longer, its penetration depth increased to 10~12 microns. The maximum stain penetration depth in Paint II was ~6 microns after the longest staining time of 24 h. Lower surface concentration and reduced stain penetration result in an easy-to-clean paint surface. These conclusions from semi-quantitative analyses of Raman spectra are in excellent agreement with the color measurements on the same panels.
Color change as a function of grape juice staining time is shown in Figure 17 for Paint I and Paint II. The DE or degree of discoloration corresponds to the concentration of staining compound adsorbed by and entrapped in the coating. Similar to the magnitude of curve shifting in Figure 16, the DE value increases linearly with the increase of the grape juice staining time from 20 min to four hours. Further increases of staining time up to 24 h did not cause substantially heavier discoloration, possibly because the system was approaching adsorption equilibrium after four hours. In the range of staining time studied, Paint II consistently exhibited less color change from the grape juice stain. The slope of the DE change was not as steep as that of Paint I in the linear region of staining time between 20 min and four hours. The results shown in Figures 8, 16, and 17 are self-consistent and all demonstrate that Paint II has greater stain resistance and better washability.
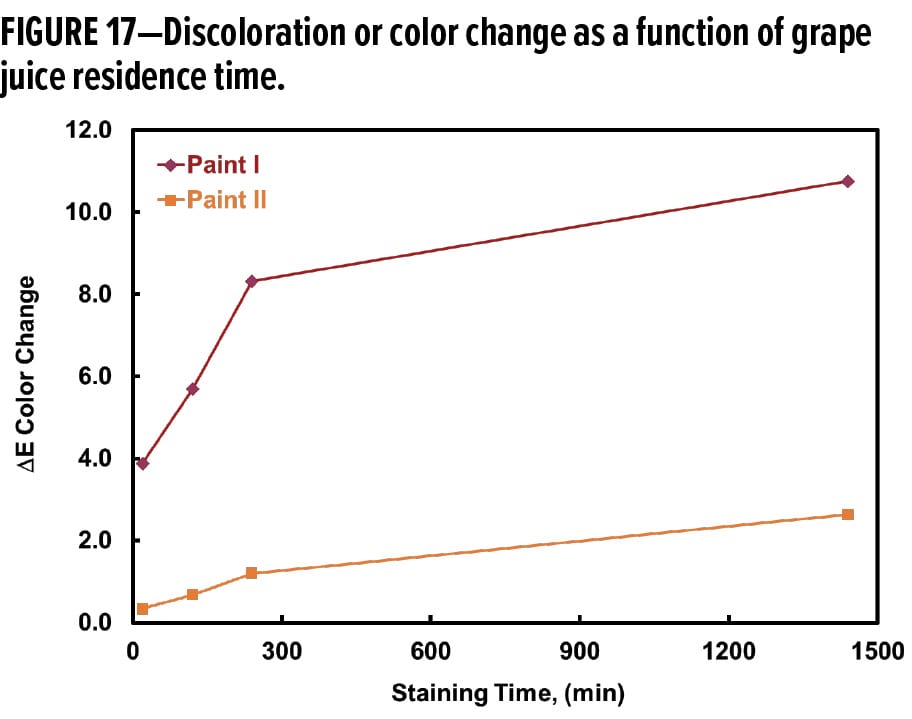
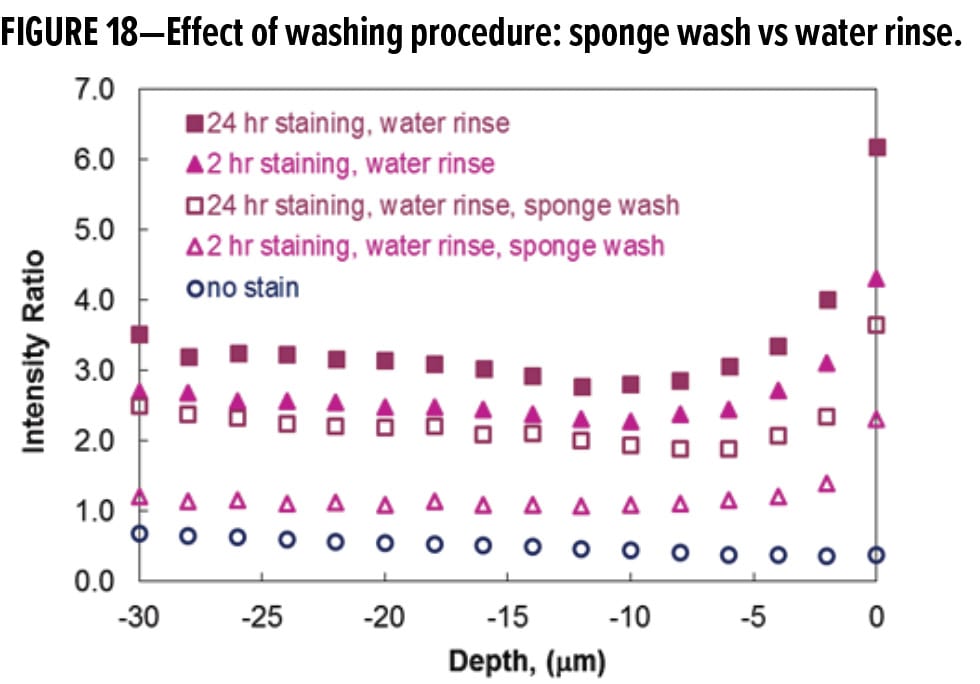
Figure 18 shows the depth profiling results for the stained and cleaned Paint I films. The experimental variables compared in Figure 18 are staining time (2 vs 24 h) and cleaning procedure (water rinse vs water rinse followed by sponge wash). To avoid the likely spectral interference of other cleaning chemicals, only the results from the water rinse and the sponge scrubbing using water are reported here to illustrate the effect of washing protocol. For both sets of data, the intensity ratio indicative of stain concentration is lower after the sponge wash using water. The mechanical forces involved in the sponge washing procedure more effectively removed the grape juice stain than just a water rinse. The minimum between 10~12 microns in the intensity ratios, however, was not changed by the more forceful sponge washing. Figure 18 also demonstrates that once stain penetration occurred, the staining depth was basically unchanged by mechanical sponge scrubbing. The results indicate that film erosion was not the mechanism for stain removal from the Paint I surface, and that the thickness of dried grape juice did not introduce significant measurement error. Therefore, the data in Figure 18 verified that depth determination using CRM is reasonably accurate and reproducible.
Latex paints all have varying degrees of porosity, depending on the formulation (e.g., choices of binder, pigments, and PVC). The penetration of a liquid in porous systems is usually viewed as a spontaneous process driven by capillary forces.38 Penetration of a liquid stain can be estimated using the classic Lucas-Washburn-Rideal (LWR) equation39: 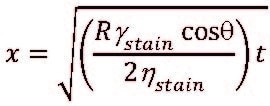
where γ and η are the surface tension and the viscosity of the stain, respectively; θ is the contact angle; and R is the porosity of the coating film. In addition, the LWR equation also describes the dependence of penetration distance on time: .
![]()
No attempt was made to model grape juice penetration with regards to its time dependence because of the data range. Raman depth profiling was done in 2-μm step-scan increments (i.e., a noncontinuous variable) and the deepest stain penetration distance was 10~12 microns (i.e., a relatively small range from 4 to 12 microns). Additionally, to hold the liquid stains in place, the grape juice was applied to a layer of absorbent paper towels covering the paint surface. This particular method of stain application complicates or alters the interaction of the stain with the coating surface. Consequently, the experimental data are not expected to strictly follow the theoretical predictions of a stain’s wetting, adhesion, and penetration behaviors. However, the semiquantitative determination of stain adhesion/adsorption, penetration, and removal using the CRM data analysis procedure was validated by the visual observations and washability results. Not surprisingly, staining time and washing procedures both influence stain adsorption/desorption and ultimately stain removal or washability. The results of the two acrylic paints clearly demonstrate that good washability can be achieved by optimizing stain resistance of paint films and minimizing stain adsorption and penetration. A stain-resistant coating like Paint II is thus highly preferred because it can minimize or prevent wetting, adhesion, and penetration of staining materials.
Conclusions
This article reports on surface and depth profile characterization of waterborne coatings using confocal Raman microscopy (CRM) and confocal laser scanning microscopy (CLSM). Using Raman intensity ratios, a uniform spatial distribution of a styrenated additive (SA) throughout the acrylic paint film was confirmed. The second derivative analysis of CRM data revealed that surfactant migration was detectable in the pigmented paint film as well, even though the concentration of polymerization surfactant is significantly reduced in the paint formulation. Utilizing the intrinsically fluorescent color compounds present in the Welch’s grape juice, CLSM was explored for direct visualization and quantification of stain penetration and removal. A novel data analysis approach developed in this work allowed the use of CRM for semiquantitative characterization of adsorption, penetration, and removal of grape juice stains. Fluorescence has been an unwanted limitation of Raman spectroscopy, but this shortcoming was effectively utilized in this work. The results correlated well with the data obtained by the conventional stain removal or washability test and at the same time provided valuable insight into staining and stain removal processes.
Both CRM and CLSM offer chemical specificity and high-resolution spatial analysis and are thus powerful tools for determining chemical composition and component distribution of multi-component coating systems. The examples described in this article effectively demonstrate the usefulness and advantage of these confocal scanning techniques and the need for continued method development to expand their application in coatings research.
Acknowledgments
The confocal fluorescence images were generated by Dr. Gang Pu and Dr. Jilin Zhang in Professor Steve Severtson’s group at the University of Minnesota. Fluorescence absorption and emission spectra were collected by Dr. Evgeny Danilov in the Laboratory for Imaging and Kinetic Spectroscopy at North Carolina State University. Their assistance is greatly appreciated.
References
- “Confocal Raman Microscopy,” in Springer Series in Optical Sciences 158, Chapt. 11, Diening, T., Hollricher, O., and Toporski, J. (Eds.), Heidelberg: Springer-Verlag Berlin, 2010.
- Wu, W., Miller, C.M., and Severtson, S.J., “Alkali-soluble resins (ASR) and acrylic blends: influence of ASR distribution on latex film and paint properties,” J. Coat. Technol. Res., 13, (4) 655-665 (2016).
- Schrof, W., Beck, E., Königer, R., Reich, W., and Schwalm, R., “Depth profiling of UV cured coatings containing photostabilizers by confocal Raman microscopy,” Prog. Org. Coat., 35, 197-204 (1999).
- Adamsons, K., “Chemical surface characterization and depth profiling of automotive coating systems,” Prog. Polym. Sci., 25, 1363-1409 (2000).
- Marton, B., van de Ven, L.G.J., Otto, C., Uzunbajakava, N., Hempenius, M.A., and Vanso, G.J., “A depth-resolved look at the network development in alkyd coatings by confocal Raman microspectroscopy,” Polymer, 46, 11330-11339 (2005).
- Posset, U., Gigant, K., Schottner,G., Baia, L., and Popp, J., “Structure-property correlations in hybrid Sol-Gel coatings as revealed by Raman spectroscopy,” Opt. Mater., 26, 173-179 (2004).
- Zhang, W.R., Lowe, C., and Smith, R., “Depth profiling of clear coil coating by confocal Raman microscopy,” Prog. Org. Coat., 66, 141-148 (2009).
- Zhang, W.R., Zhu, T.T., Smith, T., and Lowe, C., “An investigation on the melamine self-condensation in polyester/melamine organic coating,” Prog. Org. Coat., 69, 376-383 (2010).
- Zhang, W.R., Zhu, T.T., Smith, T., and Lowe, C., “A non-destructive study on the degradation of polymer coating I: Step-scan photoacoustic FTIR and confocal Raman microscopy depth profiling,” Polym. Test., 31, 855-863 (2012)
- Dupuie, J.L., Weber, W.H., Scholl, D.J., and Gerlock, J.L., “Clearcoat analysis in isolated and multi-layer paint systems by confocal Raman microscopy,” Polym. Degrad. Stab., 57, 339-348 (1997).
- Schrof, W., Beck, E., Etzrodt, G., Hintze-Brüning, H., Meisenburg, U., Schwalm, R., and Warming, J., “Depth-resolved characterization of UV cured coatings by confocal Raman and two-photon microscopy,” Prog. Org. Coat., 43, 1-9 (2001).
- Ketler, W.H. and Richter, G., “Investigation on topology of platelet-like effect-pigments in automotive surface-coating,” Prog. Org. Coat., 31, 297-306 (1997).
- Schneider, O., Hevbare, G.O., Scully, J.R., and Kelly, R.G., “Confocal Laser Scanning Microscopy as a Tool for In Situ Monotoring of Corrosion Underneath Organic Coatings,” Electrochem. Solid-State Lett., 4 (12) B35-B38 (2001).
- Faÿ, F., Linossier, I., Peron, J.J., Langlois, V., and Vallée-Rehel, K., “Antifouling activity of marine paints: study of erosion,” Prog. Org. Coat., 60, 194-296 (2007).
- Li, Y. and He, B., “Characterization of ink pigment penetration and distribution related to surface topography of paper using confocal laser scanning microscopy,” BioResources, 6 (3) 2690-2702 (2011).
- Bearman, G. and Levenson, R., “Biological Imaging Spectroscopy.” In: Vo-Dinh, T. (Ed.), Biomedical Photonics Handbook, 1st ed., CRC Press: Boca Raton, FL, 8-1–8-5, 2003.
- Hiraoka, Y., Shimi, T., and Haraguchi, T., “Multispectral imaging fluorescence microscopy for living cells,” Cell Struct. Funct., 27, 367–374 (2002).
- Levenson, R.M. and Mansfield, J.R., “Multispectral imaging in biology and medicine: slices of life,” Cytometry A, 69 (8) 748–758 (2006).
- Mansfield, J.R., Hoyt, C., and Levenson, R.M., “Visualization of microscopy-based spectral imaging data from multi-label tissue sections,” Curr. Protoc. Mol. Biol., 84, 14.19.1–14.19.15 (2008).
- Nie, S., Chiu, D.T., and Zare, R.N., “Robing individual molecules with confocal fluorescence microscopy,” Science, New Series, 266 (5187) 1018-1021 (1994).
- Zhou, L. and El-Deiry, W.S., “Multispectral fluorescence imaging,” J. Nucl. Med., 50 (10) 1563-1566 (2009).
- Virostko, J., Xie, J., Hallahan, D.E., Arteaga, C.L., Gore, J.C., and Manning, H.C., “A molecular imaging paradigm to rapidly profile response to angiogenesis-directed therapy in small animals,” Mol. Imaging Biol., 11, 204–212 (2009).
- Manning, H.C., Shay, S.D., and Mericle, R.A., “Multispectral molecular imaging of capillary endothelium to facilitate preoperative endovascular brain mapping,” J. Neurosurg., 110, 975–980 (2009).
- Wu, W., Kaufman, M., Schneider, J., and Grieb, R., “New acrylic polymers for high performance interior wall paints,” JCT CoatingsTech, 29-35 (August 2016).
- Lukačevic, I., Gupta, S.K., Jha, P.K., and Kirin, D., “Lattice dynamics and Raman spectrum of rutile TiO2: The role of soft phonon modes in pressure induced phase transition,” Mater. Chem. Phys., 137, 282-289 (2012).
- Nichols, M.E., Seubert, C.M., Weber, W.H., and Gerlock, J.L., “A simple Raman technique to measure the degree of cure in UV curable coatings,” Prog. Org. Coat., 43, 226-232 (2001).
- Aramendia, E., Mallégol, J., Jeynes, C., Barandiaran, M.J., Keddie, J.L., and Asuza, J.M., “Distribution of surfactants near acrylic latex film surfaces: A comparison of conventional and reactive surfactants (surfmers),” Langmuir, 19 (8) 3212-3221 (2003).
- Du Chesne, A., Gerharz, B., and Liser, G., “The segregation of surfactant upon film formation of latex dispersions: an investigation by energy filtering transmission electron microscopy,” Polym. Int., 43 (2) 187-196 (1997).
- Zhao, C.L., Holl, Y., Pith, T., and Lambla, M., “FTIR-ATR spectroscopic determination of the distribution of surfactants in latex films,” Colloid Polym. Sci., 265 (9) 823-829 (1987).
- Gundabala, V.R., Zimmerman, W.B., and Routh, A.F., “A model for surfactant distribution in latex coatings,” Langmuir, 20 (20) 8721-8727 (2004).
- Xu, G., Dong, J., Zhang, J., Severtson, S.J., Houtman, C.J., and Gwin, L.E., “Characterizing the distribution of nonylphenol ethoxylate surfactants in water-based pressure-sensitive adhesive films using atomic-force and confocal Raman microscopy,” J. Phys. Chem. B., 112 (38) 11907-11914 (2008).
- Zhang, J. and Severtson, S.J., “Characterizing the distribution of sodium alkyl sulfate surfactant homologues in water-based, acrylic pressure-sensitive adhesive films,” J. Phys. Chem. B., 115 (25) 8138-8144 (2011).
- Zhang, J., Zhao, Y., Dubay, M.R., and Severtson, S.J., “Surface enrichment by conventional and polymerizable sulfated nonylphenol ethoxylate emulsifiers in water-based pressure-sensitive adhesive,” Ind. Eng. Chem. Res., 52 (25) 8616-8621 (2013).
- Mallégol, J., Gorce, J.-P., Dupont, O., Jeynes, C., McDonal, P.J., and Keddie, J.L., “Origins and effects of a surfactant excess near the surface of waterborne acrylic pressure sensitive adhesives,” Langmuir, 18 (11) 4478-4487 (2002).
- Consumer Reports, January 2017 Online issue.
- Agati, G., Matteini, P., Oliveira, J., de Freitas, V., and Mateus, N., “Fluorescence approach for measuring anthocyanins and derived pigments in red wine,” J. Agric. Food Chem., 61 (42) 10156–10162 (2013).
- Sastry, V.L.N., “Nature of pigments in Concord grapes and their behavior during heat processing and storage,” Retrospective Theses and Dissertations, Paper 12809, Iowa State University.
- Hamraoui, A. and Nylander, T., “Analytical approach for the Lucas–Washburn Equation,” J. Colloid. Interface Sci., 250, 415-421 (2002).
- Washburn, E.W., “The dynamics of capillary flow,” Phys. Rev., 17 (3) 273-283 (1921).
Industry Profile: Dr. Wenjun Wu
Dr. Wenjun Wu is currently a Research Fellow at Arkema Coating Resins and global Waterborne Technology and Innovation Leader. She has developed numerous technology platforms and successfully commercialized over 20 new binders and rheology modifiers for applications in architectural coatings, personal care, and aircraft anti-icing fluids. A certified Six Sigma Black Belt, she has also held positions such as research leader and intellectual capital manager in The Dow Chemical Company.
Wu received B.S. and M.S. degrees from Peking University, and a Ph.D. from the University of Southern California. She was a postdoctoral researcher at Henkel Corporation from 1995 to 1996.
Wu is the recipient of many industry honors. In 2019 alone, she has been recognized for her work with two prestigious awards. In March, she and co-author Dr. Christopher Miller of Arkema received the European Coatings Show Best Paper Award for their paper, “Developing a Deeper Understanding of the Effect of Latex Design Parameters on Final Coating Film Properties.” In February, she was recognized with the Siltech Best Paper for Innovation Award at the 46th Waterborne Symposium in New Orleans. Prior to that, she has been the recipient of an ACS Best Paper Award, a Roon Foundation Award, and Society of Cosmetic Chemist Award. In addition, Wu has received 39 internal awards including two-time Arkema CEO Performance Awards, two best paper awards, and two technology center awards from The Dow Chemical Company. She is a recognized expert on emulsion polymerization, colloid and surface science, latex polymer characterization, as well as design of experiment (DOE) and statistical analysis.
When asked about what motivates her work, Wu responds, “I find a great deal of excitement in problem solving and continuous learning. I’m so blessed to have worked with and learned from many great scientists during my career. Industrial research and development has been a fun and satisfying journey because of ample opportunities to provide technical solutions to enhance and enrich people’s lives.” A personal goal is helping to develop young talents. She wishes to devote more time to coaching and mentoring researchers who are interested in the coatings field.
As evidenced in this article, Confocal Microscopy techniques have been an area of focus. According to Wu, “Non-destructive Confocal Microscopy techniques have been employed by other researchers to study curing and weathering of clear coating finishes. We have been able to extend Confocal Techniques for characterization of component distribution in non-transparent, pigmented coatings. By sharing our research results, we hope to encourage continued method development efforts to further expand the application of Confocal Techniques for more complex coating systems.”
This paper received the Siltech Best Paper for Innovation Award at the 46th Waterborne Symposium, February 24–March 1, 2019, in New Orleans, LA.
CoatingsTech | Vol. 16, No. 4 | April 2019