
By David A. Cocuzzi, National Coil Coating Association, and Kristine Rosek Bertucci, Precoat Metals, a division of Sequa Corporation
Over the decades, the North American coil coating industry has depended on the use of Hunter color space to measure and control color. The National Coil Coating Association (NCCA), now in its 57th year, recognizes that many others are using CIE* color space for day-to-day color control, and that DE2000 is considered a superior methodology to describe color difference, rather than DEHunter. After using Hunter color space for nearly 60 years and relying on the opponent-color-theory coordinates DL, Da, and Db for color control and DEHunter to define exterior weathering performance, one can assume that the current methodology is suitable, otherwise color issues would abound. But what if using CIE color space and DE2000 is a better approach? This article discusses the experiment that NCCA ran to evaluate the potential advantages of CIE color space andDE2000.
* Commission internationale de l’éclairage, or International Commission on Illumination.
BACKGROUND
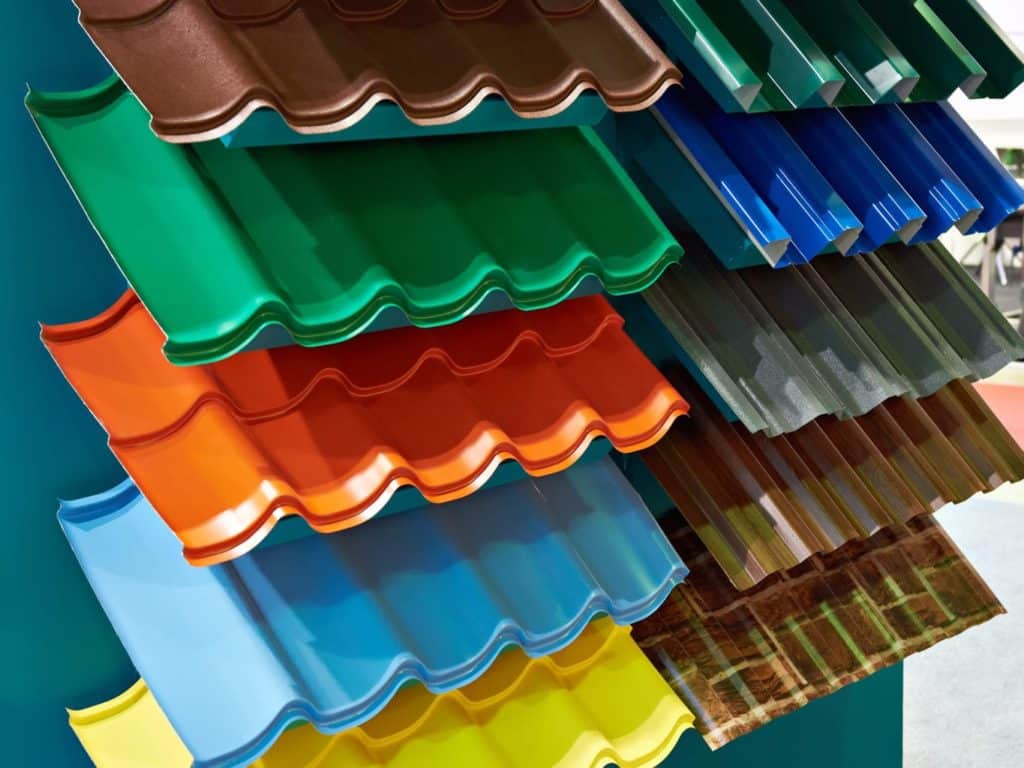
About 75% of the North American coil coating industry is associated with the production of metal building products, primarily prepainted metal panels for roofs and walls. In this industry, coatings manufacturers produce the paint, which is processed by a coil coater, which then delivers the painted coils to metal building fabricators or service centers. These coils are then processed (fabricated) into building panels for roofing and walls and delivered to the market.
Most of the metal building manufacturers have their own standard color palette offered to the consumer. Many customers, however, have a specific color in mind, and each year thousands of colors are matched and make their way to the market. This is indeed a color-intensive industry, and nearly all of these building product materials carry performance warranties passed along to the consumer—both for standard and for special colors.
The following parameters, described in ASTM E805, “Standard Practice for Identification of Instrumental Methods of Color or Color-Difference Measurement of Materials” and ASTM D2244, “Standard Practice for Identification of Instrumental Methods of Color or Color-Difference Measurement of Materials,” are commonly used in the industry to measure and control color:
- Hunter color space
- D65 Illuminant (although “C” is still used by some)
- 10° Observer (although 2° is still used by some)
- ±0.5 ΔLHunter, ΔaHunter, ΔbHunter online color tolerance
- ΔEHunter (used in warranties)
For the thousands of colors produced each year, the online color control process is scrupulously and assiduously followed. For this reason, there are minimal color complaints in the industry.
In the U.S. prepainted metal construction market, performance warranties are expected and routinely offered to the consumer. The warranties for these products typically cover:
- Film integrity (e.g., no cracking, peeling, etc.)
- ASTM D660, “Test Method for Evaluating Degree of Checking of Exterior Paints”
- ASTM D661, “Test Method for Evaluating Degree of Cracking of Exterior Paints”
- ASTM D2197, “Test Method for Adhesion of Organic Coatings by Scrape Adhesion”
- A maximum degree of chalking—ASTM D4214, “Test Methods for Evaluating the Degree of Chalking of Exterior Paint Films”
- A maximum amount of color change—ASTM D2244
Regarding color change, the typical approach in the North American coil coating industry is to use ΔEHunter as measured by a 0°/45° spectrophotometer. A 0°/45° instrument measures color as the eye sees it, with gloss and texture affecting the apparent color. A sphere with d/8° geometry, with the specular component of reflected light included, measures the reflectance at all angles and integrates these values together. This approach measures color the same for all gloss and texture levels. Customers of metal buildings, however, have only their eyes to determine if the coating has faded, and this is more realistically represented with a 0°/45° instrument.*
* The terms 0°/45°, 45°/0°, and d/8° describe color instrument geometry. For 0°/45° and 45°/0° instruments, the first value describes the angle of incident light and the second value the angle of reflected light that is measured by the detector. These two configurations are generally seen as producing equivalent results in most cases, except for extreme textures. For a d/8° instrument, an integrating sphere is used. The “d” indicates diffuse reflectance, and the detector is measuring the reflectance 8° from normal. A sphere allows for the specular (“gloss”) component of reflected light to be included or excluded. The latter set-up will produce results similar to 0°/45° and 45°/0° instruments.
It is not unusual to find performance warranties of 30–40 years (occasionally even 50 years or more), and, as a result, the entire value chain—especially the coatings suppliers—takes on a very significant degree of liability. For this reason, the industry has learned over the last 60 years how to perfect the chemistry of coatings, the application of these coatings at very fast line speeds (400–700 feet per minute), and the control of color delivered to the customer so that the final products are extremely stable and durable throughout the lifetime of the warranties, and well beyond.
Given the complexity of the industry, the demands of the coating, and the fact that there are few color-control issues in the industry, why consider a different approach to managing color? Hunter color space has worked for years, and a simple ΔEHunter value has sufficed when considering warranties. Many have pointed out, however, that CIE color space is preferred by a number of other high-performance market segments such as automotive and aerospace, which also have precise color-control requirements, and which feel that ΔE2000 is a measure of color difference that is more closely aligned to how a viewer sees and responds to the color difference. The NCCA undertook this study to determine if indeed there is a better way to approach color management, whether it is color control on a coil coating line, or a color difference measurement with regard to warranty issues.
EXPERIMENT: WARRANTY CONSIDERATIONS AND COLOR CONTROL
As previously mentioned, there are two aspects to color management in the coil coating industry:
- Color change (“fade”) as prepainted metal panels weather, a property called out in a building products warranty offered to a customer.
- Color control, both as the coating is produced by the coatings supplier and as it is applied on the coil coating line. Although we are only interested in building products in this experiment, other industries served by the coil coating industry (e.g., appliance, HVAC, truck trailer panels, metal garage doors, etc.) are equally concerned about color uniformity.
Both are critical issues to be addressed when considering a change in the method of controlling color and measuring color change during exposure, and each will be discussed individually since they are essentially independent of each other.
Warranty Considerations
Although film integrity and resistance to chalking are important parameters that are mentioned in a warranty, we will only discuss color change in this article. The usual measurement is a Hunter Delta E value (DEHunter), using a 0°/45° color instrument. This DEHunter value is a simple calculation of the distance between two points in three-dimensional space. For color, those three dimensions are DLHunter (the lightness or darkness of color), DaHunter (the redness or greenness of a color), and DbHunter (the yellowness or blueness of a color), and the total color change (DEHunter ) value is a calculation:
DEHunter= [(DLHunter)2 + (DaHunter)2 + (DbHunter)2] ½
This approach to measuring color change has proven effective over the decades, with the notable exception of saturated colors, such as bright reds and intense oranges. For such colors, it is not uncommon for the human observer to perceive little or no color difference between a sample and a standard, but the ΔEHunter system generates what appears to be unacceptably large differences in color. These exceptions are well-known and are normally handled on a case-by-case basis. A strong argument is made by many, however, that ΔE2000 is a color difference system that overcomes the anomalies with ΔEHunter.
There are a few points regarding ΔE2000 worth mentioning here:
- It requires CIE color space to be used.
- The calculation of ΔE2000 is quite complex compared to ΔEHunter. (Discussing the particulars of this ΔE2000 calculation is outside the scope of this article, but the details may be found in ASTM D2244, referenced earlier.)
- ΔE2000 is based on human observations of color difference. With these observations, the calculation of ΔE2000 takes standard reflectance data for a color and processes that information in such a way that it provides a meaningful color difference value—ΔE2000—that better correlates with what the eye sees. ΔEHunter, by contrast, does not factor in any human observation data.
Since ΔEHunter is the color difference value stated in a warranty, it is important to understand how this value corresponds to ΔE2000. To study this, 126 samples of weathered panels were measured using both ΔEHunter and ΔE2000. These panels represented a selection of:
- Various colors
- Various resin chemistries
- Various amounts of exposure time
- Various amounts of weathering
- Various coatings producers
- Various coil coaters
- Various exposure sites (although all were in South Florida)
Each exposure panel was measured using ΔEHunter and ΔE2000, and the data is shown in Figure 1, where ΔEHunter is plotted on the Y-axis and ΔE2000 is plotted on the X-axis. A simple linear best-fit line is shown, along with the equation for this linear fit.
The linear fit to the data is acceptable, but it is clear that there are data points that deviated more significantly above the line than below (i.e., the ΔEHunter was larger than the ΔE2000). Figure 2 shows these same data, where a number of these data points are highlighted, identifying those panels whose colors are saturated oranges and reds.
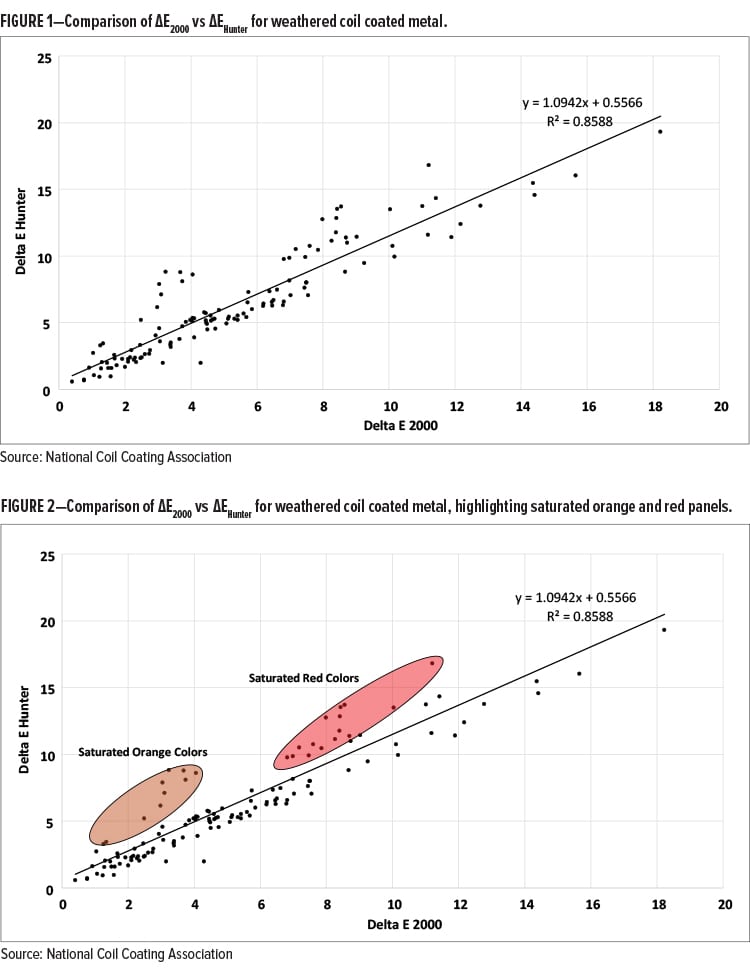
For those who study color for a living and strongly argue for the use of CIE color space and ΔE2000, the fact that saturated colors show a much larger ΔEHunter compared with ΔE2000 is not surprising. ΔEHunter is simply measuring the distance between two points in space; ΔE2000 is based upon human observations, and, as a result, the value is better able to express a color difference in line with what the average viewer actually sees. The authors visually evaluated all of the panels studied and did not feel that the orange and red panels were as weathered as the ΔEHunter data would suggest.
Fade values of 5–10 ΔEHunter for a period of 20–40 years are commonly warranted values, and in this fade value range, and for a typical range of colors used in the U.S. coil coating industry, it can be said that ΔEHunter ≈ ΔE2000. Although the NCCA color experiment is ongoing, it seems at this point that—other than changing the subscript from “Hunter” to “2000”—the warranty ΔE values would not need to be changed.
Color Control Along the Prepainted Metal Value Chain
Maintaining performance within a warranty period is critical, but of more immediate concern to the members of the value chain is online color control. Metal building panels are always overlapped or butted together, and the industry has become accustomed to placing together these building panels from various lots of paint and coils and expecting the colors to be close enough such that no complaints are received. Mentioned earlier, there is no significant color problem in the industry, so any change must be very carefully considered.
When discussing the development of ΔE2000, it is common to hear that a ΔE2000 value of 1.0 or less will represent a color difference that is acceptable to a large group of observers (i.e., no noticeable difference will be observed). With the help of NCCA members, an early experiment indicated that a ΔE2000 value of 1.0 appeared to be far too liberal in this industry.
If a ΔE2000 value of 1.0 is too large, then what is the value that should be used? After discussing this issue with many in the color science field, it was apparent that NCCA was going to need to perform its own visual assessment experiment.
To do such an experiment:
- A light booth is necessary such that everyone is observing panels under identical lighting conditions. A D65 daylight illuminant setting was used for this experiment, which best represents the lighting condition under which metal building products are commonly observed.
- A large number of panel pairs of various colors is required. For our experiment, a panel pair was simply two panels placed together, touching each other on the longer side of each panel. Each panel was approximately 5 inches x 8 inches. These two panels were taped together (from the back) to facilitate shuttling panels in and out of the light booth and to be certain that the relative position of each panel in the pair was identical for each observer.
- These panel pairs must demonstrate small color differences, modest color differences, and relatively significant color differences, all in an effort to assess the observers’ abilities to distinguish the degree of color differences.
- A large number of observers must view these samples.
- The observers must rate the closeness of each color pair using a standard scale.
Hundreds of panels were collected from coatings suppliers and coil coaters. Some of the panels represented routine production from coil lines, while other panels were created in the laboratory to produce a certain color difference. After reading and storing the reflectance data on all panels, 54 color pairs were selected to be shown to the observers, encompassing the range of colors that are routinely encountered in the building products industry.
NOTE: These panels were all “solid colors” (i.e., no metallics, no pearlescents, and no polychromatics), of which the industry is primarily comprised.
During a trade show (Metalcon 2017), these panel pairs were shown to 28 observers. The pairs were placed in the light booth, and the observer was asked not to touch the panels, but simply to make an observation. Each observation took about 15–30 seconds, so it took approximately 30 minutes for each observer to assess the 54 sets of panels. Over the two-and-half-day trade show, 1,512 data points were collected over 13 hours. Each observer was tested for color blindness using an online version of the Ishihara Color Test. Three were color blind; two knew this already, and the other suspected it. These three individuals also evaluated the panels, and their data was included in the group’s data in an effort to understand if their observations would be distinctly different than those participants with normal color vision.
The observers could not see any identification on the panels that they were viewing. Panels were simply placed in the light booth for them, their observations were recorded, the panel pair was removed, and then another pair was positioned in the light booth for observation.
For this experiment, the rating scale presented in Table 1 was used:
TABLE 1—Experimental Rating Scale
| Rating Value | Color Difference |
| 5 | No color difference |
| 4 | Extremely slight color difference |
| 3 | Slight color difference |
| 2 | Noticeable color difference |
| 1 | Very noticeable color difference |
The observers did not know that among the 54 pairs were:
- 15 “repeat” pairs —a set of panels that they had already seen earlier in the experiment, and, without knowing it, were observing and rating a second time.
- Eight identical pairs (i.e., large panels of eight different colors were cut in half and taped together; no color difference exists within each of these eight pairs).
DATA ANALYSIS
The following four analyses were done:
- Comparison of each observer’s score for each panel pair vs the average score of the entire group for the same panel pair.
- Evaluation of each observer’s level of repeatability (i.e., their ability—or lack of ability—to make an identical observation the second time they saw a panel pair). NOTE: The observers were not aware that they were seeing a “repeat.”
- Evaluation of the scores given to the identical pairs of panels.
- Determination of the group’s average rating of each panel, and representation of these average values plotted against ΔE2000 and ΔEHunter.
Comparison of Each Observer’s Score vs the Average Score of the Group
For the first analysis, each observer’s individual observation of each individual sample (i.e., a panel pair) was compared against the group’s average of that same sample. For example, if Observer #1 rates the first panel pair as a “4” (an “extremely slight color difference”), and the group average is 3.56, Observer #1’s rating difference is +0.44 (this observer sees the color difference of the panel pair about a half-rating value greater—
i.e., a closer color match—than the group). If Observer #1 rates the second panel pair at a “2,” but the group average is 3.11, then the deviation is –1.11 (that observer saw the color difference as greater than the group). This was done for all 54 panel pairs rated by Observer #1. Then the same analysis was performed for Observers #2–#28.
By adding all of these deviations for each observer for each of the 54 panel pairs, and then dividing this cumulative value by 54 (the number of observations), each observer has an average deviation from the group’s average value shown on the Y-axis in Figure 3. Values above the Y-axis value of “0” line indicate that the observer saw color pairs as being generally a closer match than the rest of the group. Values below this line indicate that the observer saw greater color differences than the rest of the group.
NOTE: Observers #8, #10, and #21 were color blind.
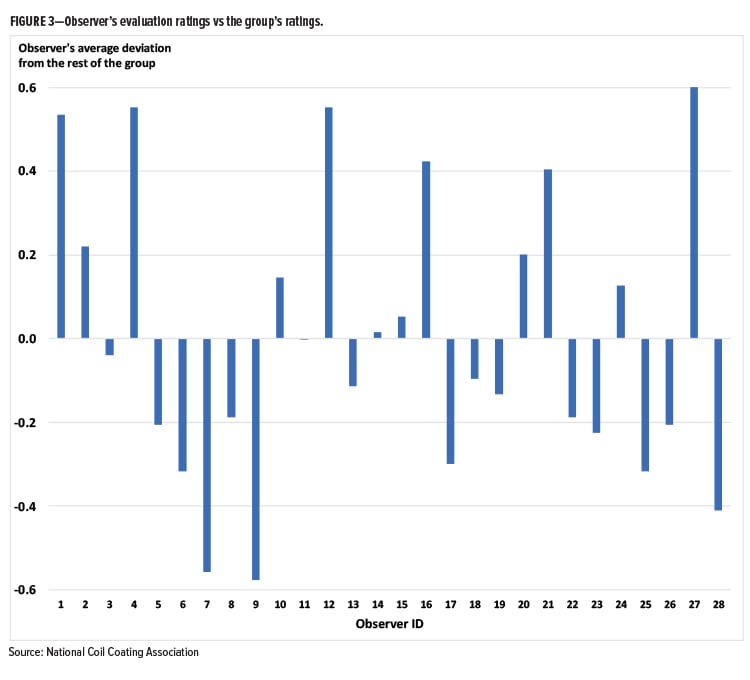
A few observations may be made regarding the above data. Observers 1, 4, 12, and 27 saw less color difference than the rest of the group. Also, Observers 7 and 9 saw more color difference than the rest of the group. The upper and lower Y-axis values, however, are only 0.5–0.6 rating units in the positive or negative direction of the baseline. This means, for example, that the average visual assessment value is about halfway between “slight color difference” and “extremely slight color difference,” or about halfway between “slight color difference” and “noticeable color difference.” These are not significant observational differences.
This data is not surprising. We all see color differently, which is one of the motivations that drives color scientists to create an instrumental approach to managing color. Figure 3, however, demonstrates the challenge that they face.
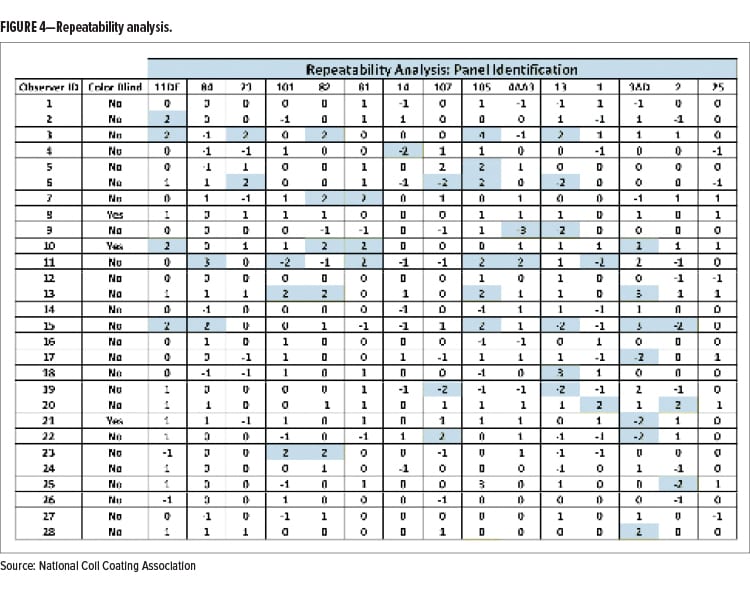
Evaluation of Each Observer’s Level of Repeatability
Of the 54 pairs of panels, 15 of them were repeats. The observers were not aware that they had seen the same panel pair earlier, so this was a test to determine how repeatable their observations were. Lacking a standard, accepted protocol to make such a comparison in this kind of experiment, it is best simply to show a data table, Figure 4, where deviations from the first observation by two or more rating points are highlighted in blue. Positive values mean that the observer offered a higher rating (they saw a closer color match) the second time they saw the panels, and negative scores describe observations that are worse (they saw a greater color difference) the second time around. For difference values of –1, 0, and +1 in Figure 4, the cells are not highlighted, since the difference between the two readings is close enough to be considered the same assessment value.
Twelve percent of the 420 observations show significant variability. As can be seen in Figure 4, eight of the observers (#1, #8, #12, #14, #16, #24, #26, #27) showed no variability (where variability here is defined by greater than ±1 rating unit), and six observers (#3, #6, #10, #11, #13, #15) showed significant variability (i.e., three or more occasions of significant variability). The remaining 14 observers demonstrated just one or two occasions where they rated the panels pairs quite differently the second time.
Recognizing the challenges of human color assessment, this data suggests that—although not perfect—22 of the 28 observers were reasonably repeatable.
Evaluation of the Scores Given to the Identical Pairs of Panels
Visual color experiments benefit by showing observers identical panels but, of course, not identifying them as such. For these samples, eight different colors of painted metal samples from a coil coating line were cut in half and then placed next to each other. They appeared to the observer to be just another set of panels to observe. Two of these sets were repeated, so, in all, 10 sets of samples had no color difference.
The ratings are shown in Figure 5, and values with a rating of “3” or less (“slight color difference,” “noticeable color difference,” and “very noticeable color difference”) are highlighted. In an effort to highlight larger color differences, a rating of “4” (“extremely slight color difference”) was allowed to be considered the same as “5” (“no color difference”), and therefore not highlighted.
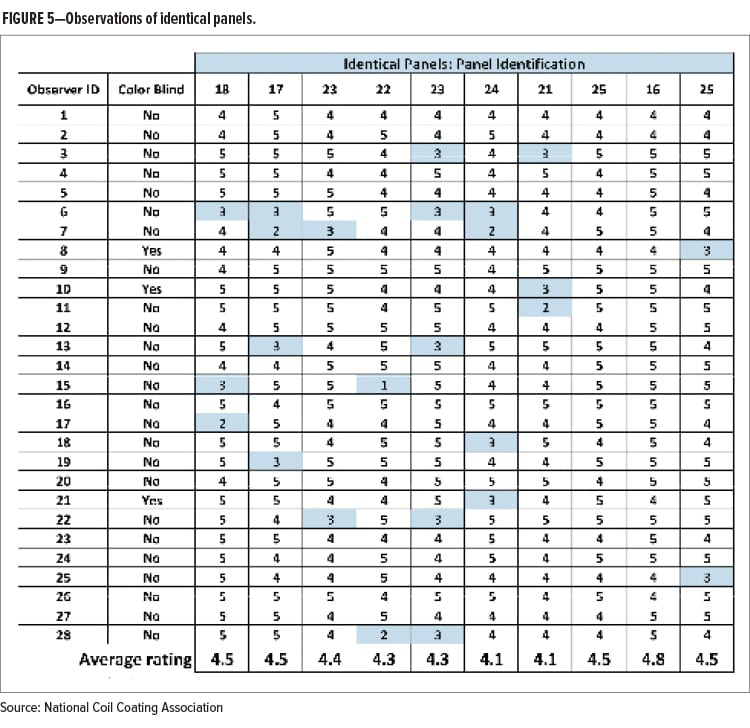
First, consider the average ratings of the 10 sets of panels. They ranged from 4.1 to 4.8, and most of the values were midway between a “4” and “5” rating—i.e., midway between “extremely slight color difference” and “no color difference.” As a group, and on average, the observers were not fooled by the fact that they were shown panels with no color difference.
Since this experiment is allowing a “4” rating (“extremely slight color difference”) to be equivalent to a rating of “5” (“no color difference”), one-half of the observers (14 out of 28) saw no color difference between each of the 10 panel pairs.
Of the 280 ratings, only 9% of them were “3” or greater (i.e., “slight color difference,” “noticeable color difference,” and “very noticeable color difference”). In discussing these results with members of ASTM Committee E12 Appearance and Color, they were surprised by how low the 9% value was. In some of their own experiments, the numbers could be as high 30% of the people seeing color differences where none existed. Of course, all visual color experiments use different samples and different sets of observers. In this experiment, all of the observers play some role in the coil coated building products value chain, but the clear majority of them did not consider themselves to be color experts (and, of course, neither is the consumer). Nonetheless, it seems safe to conclude the 9% value represents confirmation bias—when you expect to see a color difference, you do, even when none exists.
Determination of the Group’s Average Rating of Each Panel, and Representation of These Average Values Plotted against ΔE2000 and ΔEHunter
Using the instrumental color difference values along with observers’ ratings, a plot can be made with the observers’ ratings (the group average) plotted on the Y-axis and the Delta E value (either DEHunter or DE2000) plotted on the X-axis (Figure 6). Each of the 54 data points on the following graphs represents the group-average rating for each panel pair.
Clearly, there is a great deal of scatter. This is not unexpected, of course, and one can see the general trend showing that color difference increases (i.e., ΔEHunter values are increasing) as the visual assessment ratings are decreasing (i.e., greater visual color difference between the panels). In an effort to create a more helpful picture of the above data, consider this treatment of the data in Figure 7.
In Figure 7, a horizontal line is drawn for a Y-axis value of “3,” which represents a “slight color difference” rating. Let us assume that this level of color difference would be acceptable for the prepainted metal building products industry.
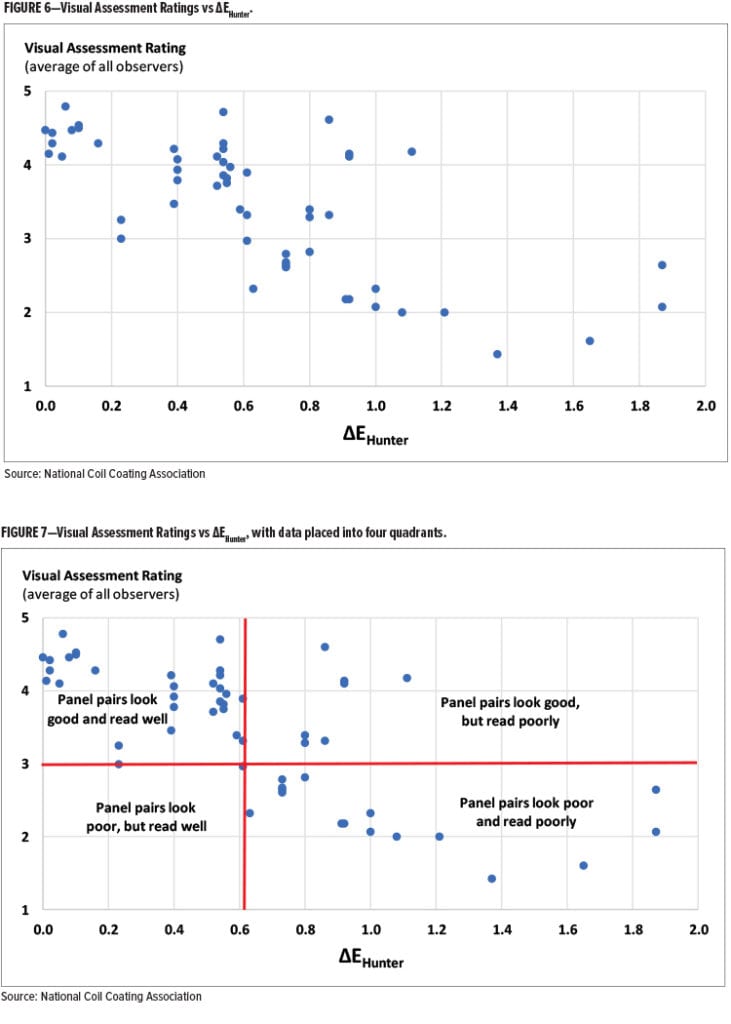
There is also a vertical line drawn. It happens to meet the X-axis at a value of ∼0.6, but it has intentionally been placed to prevent any data points falling in the bottom-left quadrant for reasons to be explained shortly. The four quadrants have been labeled in this manner:
- Upper-left Quadrant—“Panel pairs look good and read well.” Here, the panels not only appear to the observers as matching closely to each other, but theΔEHunter data supports those readings.
- Bottom-right Quadrant—“Panel pairs look poor and read poorly.” In this area, the panels appear as poor matches to the observers, and the instrumental data also shows large values of color difference.
- Upper-right Quadrant—“Panel pairs look good but read poorly.” These panels were declared to be reasonably close in the eyes of the observers, but instrumentally they read poorly. The observers were happy with the color match, but the instrumental readings told a different story. The coil coating industry, however, usually depends upon instrumental color reading data. This fact does not make the instrument reading correct and the observer wrong. In fact, only the consumer must be satisfied, and in the upper-right quadrant in Figure 7, the consumer would be happy with the color match, regardless of what the instrument says.
- Lower-left Quadrant—“Panel pairs look poor, but read well.” Any data point that falls into this quadrant presents an untenable situation: the panel pairs looks bad, but the color instrument reading is good. Since a poor visual match may present an issue with the customer—regardless of the instrumental reading—the red lines have been positioned to keep this quadrant empty.
In Figure 7, there are seven outliers (upper-right quadrant), where the observers were happy with the color, but the color difference using ΔEHunter was indicating a poor match.
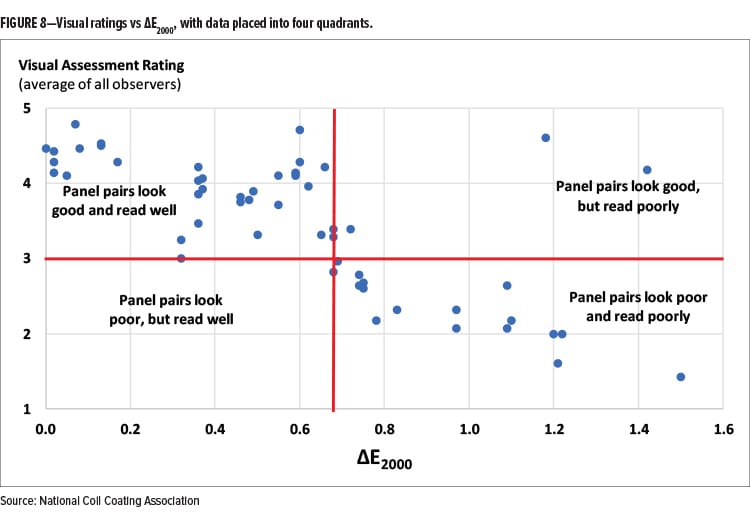
Figure 8 takes the same observation data, but plots the color difference values using ΔE2000 on the X-axis, instead of ΔEHunter.
Here, notice the two clear outliers in the upper-right quadrant, although the one data point very near the vertical bar is perhaps too close to call. The other two points are of greater interest (and they also both appear in the ΔEHunter plot). One is a black color with a near-perfect visual match. Color experts in ASTM Committee E12 feel that black panels that are as jet black as this panel pair will always confuse a color instrument, as well as the human eye. There is simply not much reflectance—at any wavelength—and, as a result, tiny differences in reflectance become translated to large ΔE differences (whether it is ΔEHunter or ΔE2000). The human eye, on the other hand, cannot see the difference.
The other outlying data point is also a dark color—a dark purple panel. In this case, under normal sunlight illumination, there is no question that a large visual color difference exists. A possible explanation is that the portable light booth did not provide enough lumens of illumination to allow color differences for such a dark purple color pair to be easily seen.
Even with all the scattered data, by comparing Figure 7 to Figure 8, it is clear that the use of ΔE2000 better agrees with visual observations than Hunter color space.
Is it better enough, however, to justify having an entire industry change from its historic, decades-long use of Hunter color space, controlling color online with the usual tolerance values (±0.5 ΔLH, ΔaH, ΔbH), and using ΔEHunter when offering a fade warranty? A conservative approach is being recommended, so the answer is “not yet!” More work is needed, and, even if a change is recommended, the coatings companies and coil line operators have spent a career speaking in color terms of lighter/darker, redder/greener, and yellower/bluer. Many—especially the coil line operators—have learned a variety of “tricks of the trade” to modify ΔLHunter and/or ΔaHunter and/or ΔbHunter values slightly without compromising other properties. For example, increasing the bake temperature slightly can move a light color slightly darker and perhaps slightly yellower. At this time, it is ill-advised to remove this knowledge of directionality from those that have depended upon it for so long. That said, all signs are positive that ΔE2000 will provide benefits.
NEXT STEPS
As NCCA moves into the second phase of the project, coil coaters are being asked to measure color as they normally would (Hunter color space), capture the usual data (DLH, DaH, DbH), but, additionally, collect DE2000 data. The plan is to create a very large data set and determine if it makes sense to continue to use DLH, DaH, DbH values for the reasons just stated.
CONCLUSIONS
The work done to-date by NCCA is a good first step. There is still much work to perform with member companies. The concept of changing an approach to managing color needs to be thoroughly communicated across the value chain, starting with the coating vendors who supply to this industry, the coil coaters who process the paint to exacting standards, and the fabricators who receive the painted coils, fabricate these coils into a product, and move these products into the market. After 50+ years, the industry has acceptable control of color properties and has created “work-arounds” to accommodate the weaknesses of the current color space and color difference calculations. Changing something that “ain’t broke” must be done carefully, and NCCA will be seeking input from industries that have gone through a similar conversion process to seek both positive and negative input.
Acknowledgments
This work could not have been accomplished without the efforts of many in the coil coating industry. Special thanks to Sam Cauchi, Datacolor; Jim Macdonald and Jim Roberts, BYK Additives & Instruments; and George Pilcher, The ChemQuest Group, each of whom spent considerable time helping to devise the experiments, collect the data, and assist in the processing of the information.
CoatingsTech | Vol. 16 | No. 1 | January 2019