
By Allen Irish, American Coatings Association
The first weeks of 2016 have been marked by two—potentially related, in the view of some observers—important economic developments. The first is the continuing decline in prices in the petroleum sector, with the benchmark Brent price for oil dropping nearly 13% since the start of the year (Figure 1).1 The second is substantial turmoil in the global equities markets, with key benchmarks for global stocks dropping from about 7% in the New York Stock Exchange to nearly 20% in the Shanghai Composite Index since the beginning of the year.
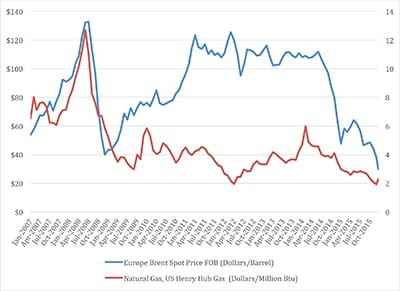
Figure 1—Oil/gas price trends.
A number of market analysts and business journalists have suggested that there is a connection between collapsing oil (and broader energy) prices and the broad decline in share prices on global exchanges. 2 While it is never clear what forces drive equities prices, there is likely to be some connection between the two trends. And even if there is not a clear or obvious cause and effect relationship, dropping oil and energy prices clearly impact the coatings industry and the broader chemical industry, creating benefits for some sectors, while possibly adversely affecting others.
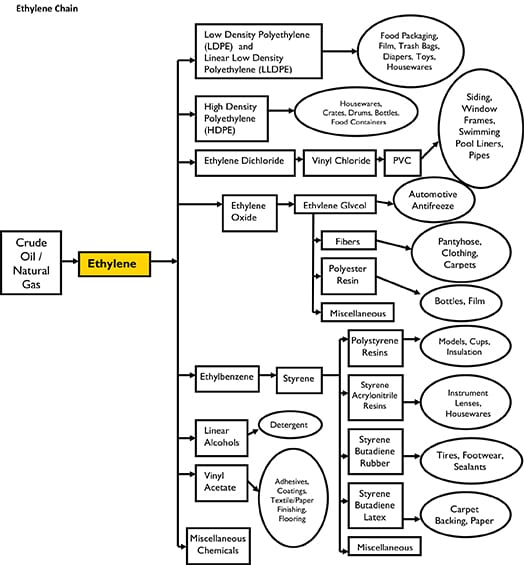
On the plus side, falling prices for energy and in particular oil and gas do directly impact the cost of manufacturing chemicals.3 Oil (largely in the form of naphtha) and gas (whether ethane, propane, or other natural gas liquids) are key feedstocks for producing any number of building block chemicals, such as ethylene or propylene. These materials, in turn, are further processed to become the foundational chemicals used in coatings, such as resins and solvents.
Figure 2 illustrates the value chain for ethylene, which in turn is the base for the manufacture of key coatings industry materials, such as vinyl acetate and styrene butadiene. Clearly, falling prices for the building blocks for these materials can drive price reductions for the more finished materials produced by chemical manufacturers.
Pricing trends for paint raw materials4 suggests that this relationship exists, at least in this industry. The PPI (Producer Price Index) data for “organic chemicals,” shown in Figure 3, illustrate most directly where falling feedstock prices are driving historical pricing for many materials going into coatings, such as resins and solvents. Figure 3 also shows historical pricing for paint colors, a grouping that includes the key pigments used in coatings, including titanium dioxide. As a result, the ACA raw materials index, which combines a variety of PPI inputs for the materials going into a “typical” paint formulation, shows a significant downward trend over the past year or so.
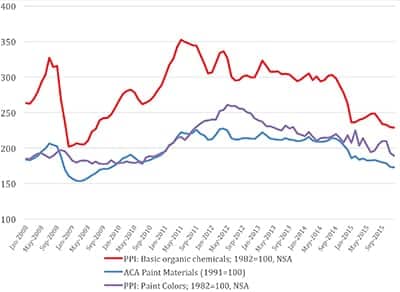
FIGURE 3—Producer Price Indexes.
The drop in energy prices is clearly reflected in the pricing trends recorded by BLS for a variety of materials. This should be, on the whole, a good thing for the U.S. economy and for the coatings industry. Over roughly the past decade, the United States has met an ever-larger portion of its energy demand through domestic energy production (Figure 4), and is nearing the point at which the U.S. produces energy in excess of domestic demand. This decreasing reliance on imported energy has somewhat alleviated the negative effect on GDP caused by increased demand for imported goods, especially durables. The falling prices generated by increased supply of energy has also affected American consumption. For example, energy costs are traditionally a significant expenditure item for Americans, and the drop in energy pricing has produced (and is projected to continue doing so) a significant drop in the amount of GDP that is devoted to paying the national “energy bill” (see Figure 5).
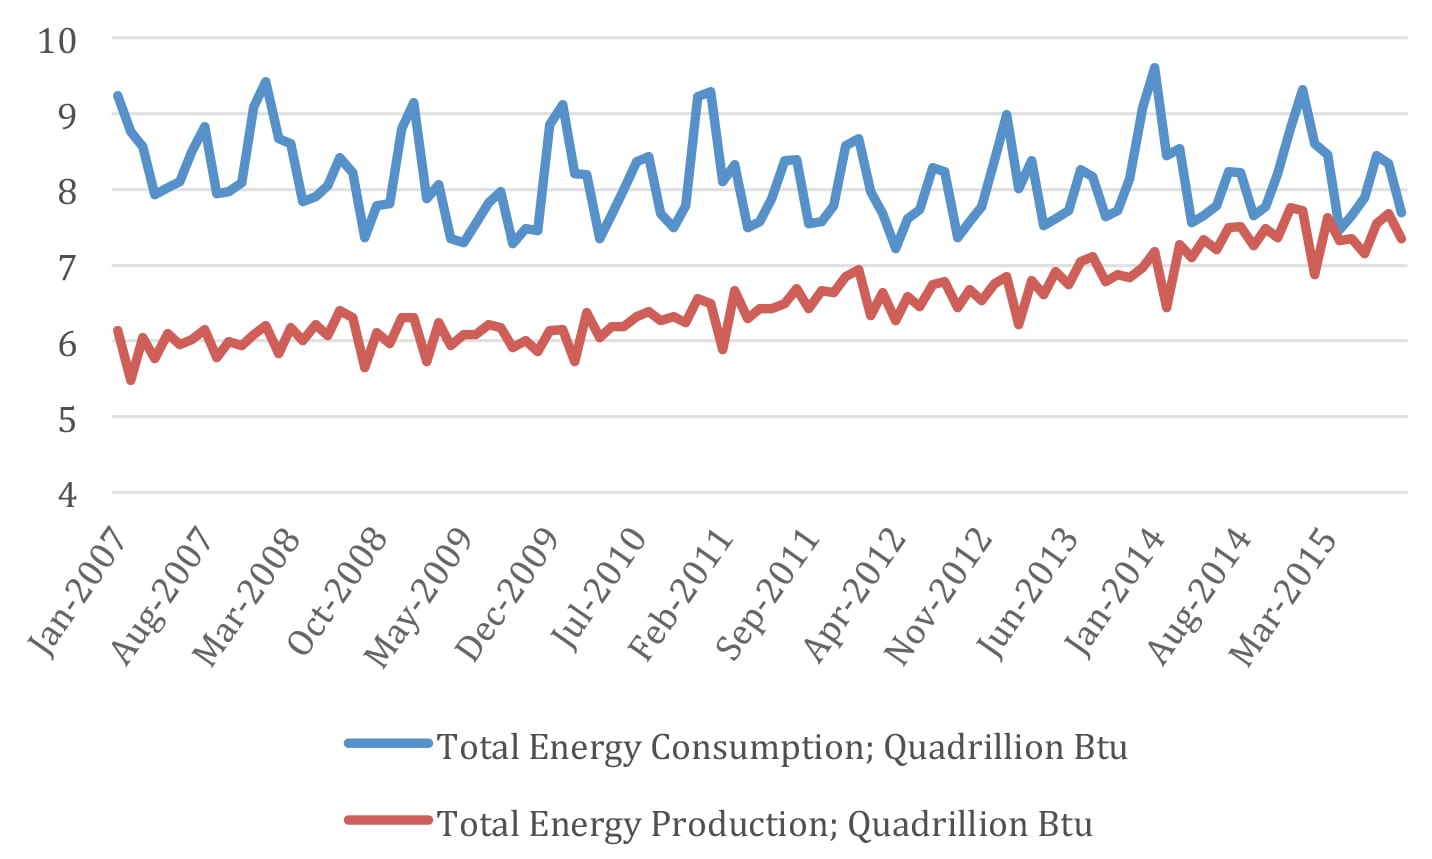
FIGURE 4—Total energy production and consumption.
FIGURE 5—Energy expenditures as share of GOP (%).
The increase in production of natural gas and petroleum has not only had significant impact on the macro economy, but also the chemical industry in particular. The primary sources of feedstocks used for the production of many of the value chains for key paint resins and other organic chemicals are natural gas (ethane) and oil (naphtha). The significant decline in natural gas pricing that began in 2008 with increasing natural gas production from shale formations has made increasing volumes of natural gas liquids available and has increased the availability of ethane, which has been the preferred U.S. feedstock for the production, for example, of ethylene. As a result of this trend, major producers have planned to add more cracking capacity. However, the recent large drop in the price of oil has made the cost of producing a pound of ethylene from ethane in the United States slightly higher than the cash cost of producing a pound of ethylene from naphtha, according to Steve Weber of Argus Consulting, a London-based business intelligence firm. Weber noted that the point at which the cost advantage switches to naphtha is typically below $40/barrel. However, he indicated that this calculation is affected by other factors, including the fact that naphtha cracking produces many more coproducts, such as propylene, butadiene, and aromatics. As a result, the bottom-line cost of making ethylene from naphtha depends on the pricing of these other products as well (ethane produces virtually none of those coproducts when cracked for ethylene production). If current pricing trends persist, ethane would remain somewhat disadvantaged versus naphtha as feedstock. A small percentage of the total U.S. cracking capacity is able to switch between ethane and naphtha depending on pricing and availability, but newer crackers tend to be ethane only. As noted, the use of naphtha as a feedstock in lieu of ethane has implications for other value chains, as it produces propylene as a co-product, which would make it less necessary to produce “on-purpose” propylene using different feedstocks and potentially affecting availability of products based on propylene, such as acrylic acid.
Paul Bjacek, a chemical industry expert at Accenture, has noted other potential factors affecting the feedstocks issue. For example, he indicates that “several other factors are causing the world ethylene cost curve to flatten. Some of this is occurring quickly; some, longer term.” He added, “Liquefied petroleum gas (LPG) can also be used as a cracker feedstock and to dehydrogenate to propylene. Increased supply of U.S. LPG to Europe and Asia is reducing LPG prices globally. This is already improving cracking competitiveness in Europe.”
Bjacek also indicates that “many analysts are projecting an ethane excess in North America and increased ethane rejection (i.e., leaving it in natural gas), which has limits, encouraging innovation in ethane exporting schemes. Exporting ethane in larger volumes reduces its landed cost, especially as very large ethane carriers (VLECs) are built and further logistical improvements are made. This way, U.S.-sourced ethane will lower the feedstock cost to several European and India crackers. Other regions may join the trade as well, as exporters or importers.”5
Coatings industry expert Dan Murad of The ChemQuest Group added additional detail on the coatings impact of feedstock choice. “Cracking naphtha vs. ethane, should that return to be the favored route, will in fact be good for the coatings and adhesives industry because cracking naphtha results in much higher yields for the types of C4 through C10 molecules we need as an industry. Cracking ethane meant more on purpose materials, which in the short turn is more expensive and/or importing more of these materials from places like China, where cracking naphtha is the only route.”
It is important to note in this analysis that, as a result of rising volumes of domestic supplies of natural gas, production of both ethane and propane have increased, although reported prices for ethane have been at or near fuel value. Domestic naphtha stocks have also increased, starting in early 2010 (Figures 6 and 7).
FIGURE 6—Short-term energy outlook.
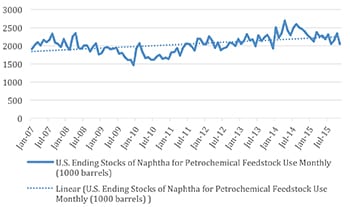
FIGURE 7—Naphtha stocks.
As a result of the increasing supply of oil and gas, new exploration and drilling activity has dropped significantly. The drop in new well activity (as implied by dropping rig counts), in particular, tracks oil prices quite closely, as shown in Figure 8. Because of sharply declining rig counts, the Eagle-Ford shale formation is showing dropping production from its peak in early 2015, even as new-well production is trending higher.6 However, Stuart Zisman, an energy partner at Bracewell and Giuliani in Houston, suggested that this trend will take some time to play out. He noted that we are “still in a state of daily oversupply, and we will be in a glut perspective for a long time. There are only a few oil plays where it still makes sense to produce.” Despite this, Zisman does not see U.S. production dropping as quickly as previously thought, and he indicated that he does not expect to see spot prices moving significantly in the next 12 months, although he observed that “the forward curve for pricing in 2018 might improve.”
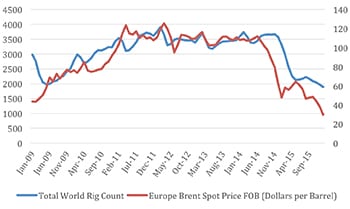
FIGURE 8—Relationship between pricing and rig counts.
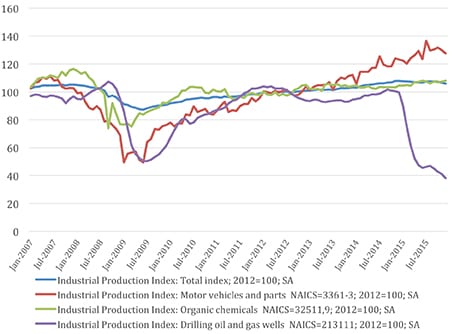
FIGURE 9—Industrial production indexes.
Another way to look at what is happening in this sector is the Federal Reserve’s Industrial Production Index figures. As shown in in Figure 9, while U.S. industrial production is up overall, the figure representing oil and gas drilling and exploration (NAICS 213111) is down sharply over the past year or so. It is likely that this trend will continue as long as oil and gas prices remain low. However, it is important to recognize that unconventional sources of oil and gas (e.g., shale) traditionally have exhibited a steeper decline in output than conventional wells, and as a result, current supply/demand dynamics may reverse more rapidly than anticipated.7
An additional factor that will continue to affect the global price of crude oil is the continuing mismatch between global supplies of, and demand, for oil.
Currently, U.S. Energy Information Administration data show that global demand has lagged rising global oil production, and has done so for at least the past two years. In particular, as shown in Figure 10, the mismatch between production and consumption has resulted in the daily addition of approximately 1.4 million barrels of crude oil to existing global stocks on average since the start of 2014. The EIA is forecasting that this imbalance will narrow and reach some parity in late 2017, but there are many unknowns in a forecast such as this, including lack of certainly as to how key actors such as Iran and Saudi Arabia will behave going forward.
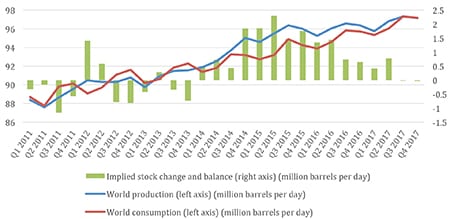
FIGURE 10—World oil consumption and production.
EIA also tracks U.S. stocks of crude, and its data also show a substantial rise in U.S. stocks in the same time frame. For example, Figure 11 shows that while total U.S. stocks were approximately 350 million barrels at the beginning of 2014, they have subsequently risen to over 500 million in early 2016.8 As the Washington Post recently reported, storage facilities are at or near capacity, and this supply overhang suggests that oil prices will remain at the current levels for some time.9
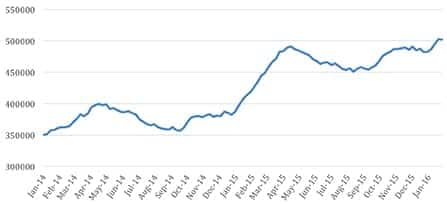
FIGURE 11—U.S. ending stocks of crude oil 1000bbl (less Strategic Petroleum Reserve).
While the impact on the coatings industry of declining oil and gas prices is generally positive because of the impact on feedstocks, there are downsides to this for certain sectors. Clearly, the industries that are selling into energy end uses are looking at down markets. For example, Caterpillar recently announced substantial layoffs that were tied to dropping demand in the mining and related sectors.10 In another recent and largely unsurprising forecast, the head of Danish conglomerate A.P. Moller-Maersk’s rig unit said that as much as one third of the global offshore fleet of oil drilling rigs could be idled in 2016 as energy firms scale back investments on the back of weak crude prices.11 It is likely that industrial maintenance, marine, OEM, and transportation coatings demand by companies tied to exploration and distribution of oil and gas (offshore rigs, machinery, pipelines, etc.) will be impacted. (This impact includes both a drop in demand for new facilities and equipment, as well as potential extended maintenance schedules for existing infrastructure.) Although essential, these affected coatings segments represent a relatively small portion of the larger coatings industry. Therefore, the impact of this decline in coatings demand, although certainly painful for firms and business units focused on those end-use markets, may not have a major impact on the entire industry.
ENDNOTES
1. Based on prices as of February 8, 2016.
2. For example, some analysts have suggested that severely declining oil revenues have required some sovereign wealth funds to repatriate funds invested in global equity markets, thus helping push pricing lower. See, for example, “This isn’t like 2008—but a correction IS coming,” CNBC.com, https://www.cnbc.com/2016/01/08/this-isnt-like-2008-but-a-correction-is-coming-bouroudjian-commentary.html (January 8, 2016).
3. The basic chemicals industry uses substantial amounts of energy to produce its products and clearly benefits from lower energy costs. It simultaneously uses energy inputs such as oil and gas as materials from which it produces materials.
4. The American Coatings Association publishes a “paint materials” index on a monthly basis, accessible in the Member Center of paint.org and in CoatingsTech. This figure, which was developed by ACA’s Management Information Committee aggregates PPI (Producer Price Index) data collected by the Bureau of Labor Statistics in a way that approximates the cost of raw materials used to produce a “typical” paint formulation. The ACA figure provides some insight into the overall cost of coatings materials and their direction.
5. See Bjacek, P., “The crunch—Low oil price effects on chemicals,” found at https://www.accenture.com/us-en/blogs/blogs-the-crunch-low-oil-price-effects-on-chemicals (February 4, 2016).
6. “Eagle-Ford Region Drilling Productivity Report,” U.S. Energy Information Administration (February 2016).
7. Chemical industry expert Bjacek observed, “So far, U.S. production has continued unabated . . . though production is expected to decline later in the year (as unconventional wells drilled in 2014 ramp up, then slow down, since production tails off by two-thirds in the first year) future increases will likely taper due to the drop in drilling rig count since September, when crude prices were heading below $80/bbl.” See, Bjacek, note 5 above.
8. This figure excludes the approximately 700 million barrels in the Strategic Petroleum Reserve.
9. “In storage, a clue to why oil price slump may endure,” The Washington Post, page A-12, February 18, 2016.
10. “Caterpillar sheds 5,000 workers in three months,” Crains, https://www.chicagobusiness.com/article/20160128/NEWS05/160129800/caterpillar-sheds-5000-workers-in-three-months (January 28, 2016).
11. “Maersk Drilling sees overcapacity on rigs for the foreseeable future,” Reuters, February11, 2016. https://af.reuters.com/article/commoditiesNews/idAFL8N15Q26B.