

By George R. Pilcher, The ChemQuest Group, Inc.
Shortly after publication of “The State of the U.S. Paint and Coatings Industry: Geopolitics, Supply Chains, and Strategy” in the November/December 2025 issue of CoatingsTech, we became aware that the adjustment of certain values would be necessary. ChemQuest’s “numbers” are refined and adjusted on an ongoing basis, which typically allows us to view the specialty chemical markets in a relatively seamless fashion without being thrown offcourse by minor blips in the performance of any given sector. Between the date of submission of the article and its publication, however, company reports for the U.S. paint and coatings market were published for second quarter results and displayed a wholly uncharacteristic slump in performance. While there are many theories regarding why this happened—tariffs and/or fear of tariffs; concerns about the bourgeoning national debt; the significant increase in global tensions with the failure to make progress toward peace in the Russo-Ukrainian War; the attack on Iran by Israel and the U.S.; and many other geopolitical concerns—it is far from clear what the specific causal factors are for the drop in production.
Regardless, the performance slump was very real and has convinced ChemQuest that a restatement of growth rates in certain sectors of both the specialty chemicals market space, as well as the paint and coatings segment within that market space, is appropriate. We are living in an unusually dynamic, and therefore volatile, period in modern history and must recognize that all global supply chains either have been, or will be, negatively affected as a result. With our thanks for your understanding and a mutual desire for up-to-date data, please note the following adjustments (figure numbers correspond to those in the original November/December publication).
FIGURE 3 U.S. paint and coatings industry, by volume and value (2020-2026f).
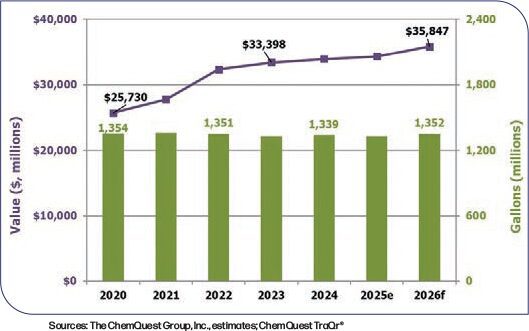
FIGURE 7 U.S. architectural coatings market segment, by volume and value (2020-2026f).
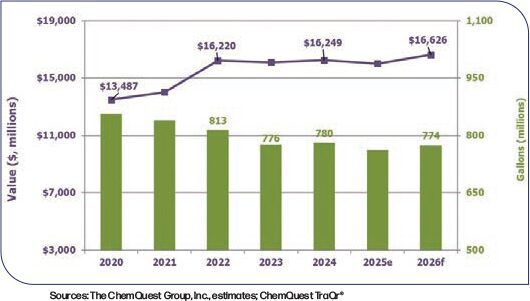
FIGURE 12 U.S. industrial OEM coatings, by volume and value (2020-2026f).
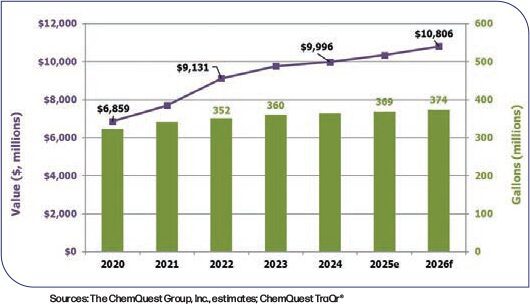
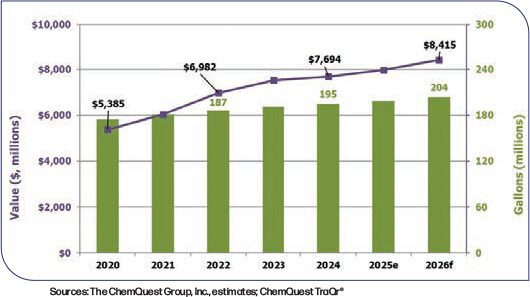
FIGURE 16 U.S. special purpose coatings, by volume and value (2020-2026f).
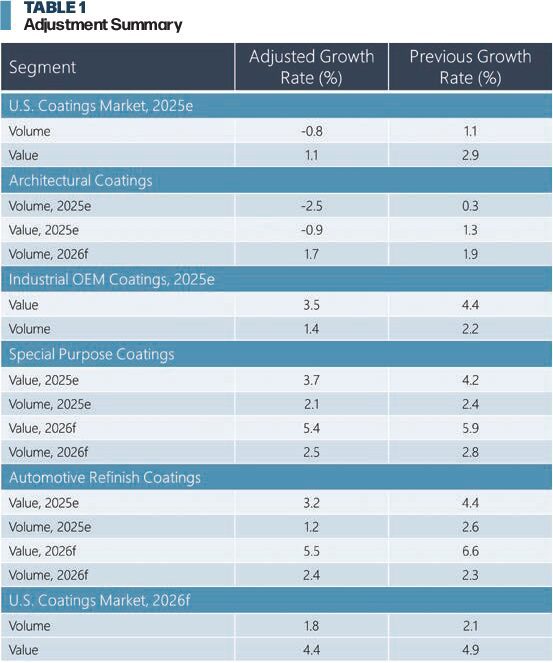
U.S. Coatings Market, 2025e
- Volume decrease of 0.8% (vs 1.1% increase)
- Value increase of 1.1% (vs 2.9%)
Architectural Paints
- 2025e volume decrease of 2.5% (vs 0.3% increase)
- 2025e value decrease of 0.9% (vs 1.3% increase)
- 2026f volume increase of 1.7% (vs 1.9%); value increase remains 3.9%
Industrial OEM, 2025e
- Value increase of 3.5% (vs 4.4%)
- Volume increase of 1.4% (vs 2.2%)
Special Purpose Coatings
- 2025e value increase of 3.7% (vs 4.2%)
- 2025e volume increase of 2.1% (vs 2.4%)
- 2026f value increase 5.4% (vs 5.9%)
- 2026f volume increase of 2.5% (vs 2.8%)
Automotive Refinish Coatings
- 2025e value increase of 3.2% (vs 4.4%)
- 2025e volume increase of 1.2% (vs 2.6%)
- 2026f value increase of 5.5% (vs 6.6%)
- 2026f volume increase of 2.4% (vs 2.3%)
Outlook for U.S. Coatings Market, 2026f
- Volume increase of 1.8% (vs 2.1%)
- Value increase of 4.4% (vs 4.9%)
Please reach out to the author at gpilcher@chemquest.com for additional information or further clarification.