
Preview of the 2017 Update to the ACA Industry Market Analysis, 9th Edition (2014–2019)
By Aggie Lotz, The ChemQuest Group, Inc.
This is a sequel to the original feature article published in the May 2015 issue of CoatingsTech. It was researched and written before Hurricane Harvey made landfall in late August and Hurricane Irma in September 2017. Following the pending clean-up effort, given the aftermath of both storms, an assessment of heavy industry in affected regions (including any damage to the freight rail network) would be expected. For planning purposes, the following article may serve as a useful benchmark relative to the state of rail rolling stock (and likewise of the production rates and movement of domestic crude oil and chemicals) before the impact of Hurricanes Harvey and Irma.
Introduction
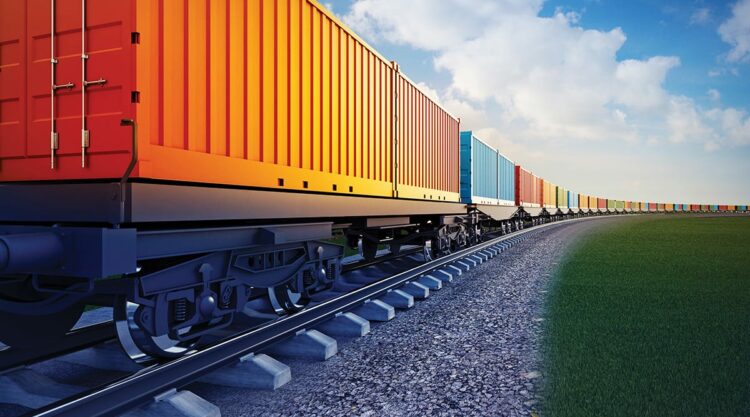
The category of rail rolling stock coatings comprises protective coating systems for tank cars, intermodal freight transport containers and hopper cars, boxcars, auto-rack cars, flat-bed cars, and locomotives. Corrosion resistance and chemical resistance in aggressive, high temperature, and high humidity environments are important coatings properties for maximizing the service life of coatings systems used on railcar and locomotive fleets, and to ensure transportation safety. Superior chalking resistance was also cited as important to the service life of coatings, which is especially well suited to the tops of railcars to protect against unmitigated UV exposure.
In the May 2015 issue of CoatingsTech, the preview of ACA’s Industry Market Analysis, 9th Edition (2014–2019) examined the effect of the historic crude oil supply boom in North America on the U.S. freight rail system. Between 2008–2014, the volume of crude oil that was transported on U.S. Class I railroads had increased by 5,100%, as tracked by the Association of American Railroads (AAR), and summarized in its May 2017 background paper found on www.aar.org.
In 2014, 493,146 originated carloads of crude oil were transported by rail compared with 9,500 carloads in 2008. Similarly, the volume of terminated carloads of crude oil rose from 9,344 in 2008 to 540,383 in 2014. (“Originated” refers to loaded carloads at the start of the run on a U.S. Class railroad, whereas terminated carloads are loaded carloads that complete the run on U.S. Class I railroads, as opposed to being terminated by railroads in Canada or by U.S. short line railroads.) By late 2014, crude oil prices started to decline precipitously primarily due to an oversupply of crude oil, and remained low at around $50 per barrel through mid-2015, when ACA’s Market Analysis was published. Since then, persistently low oil prices have put a dent in domestic oil & gas activity, decreasing downstream demand for transporting crude oil, ethanol, frac sand, and coal. In 2015, rail volumes fell to 409,949 carloads of crude oil, and by 2016, to 211,986 carloads.
Since ChemQuest’s original primary and secondary research was conducted in preparation for the Market Analysis, an oversupply of certain types of railcars that were diverted to crude and ethanol is now sitting idle due to the anomaly of the domestic crude oil boom. ChemQuest re-interviewed key coatings practitioners in the rail industry in the third quarter of 2017. More of their insights follow on the impact of freight rail transport trends and drivers on the current demand for railcar coatings and linings.
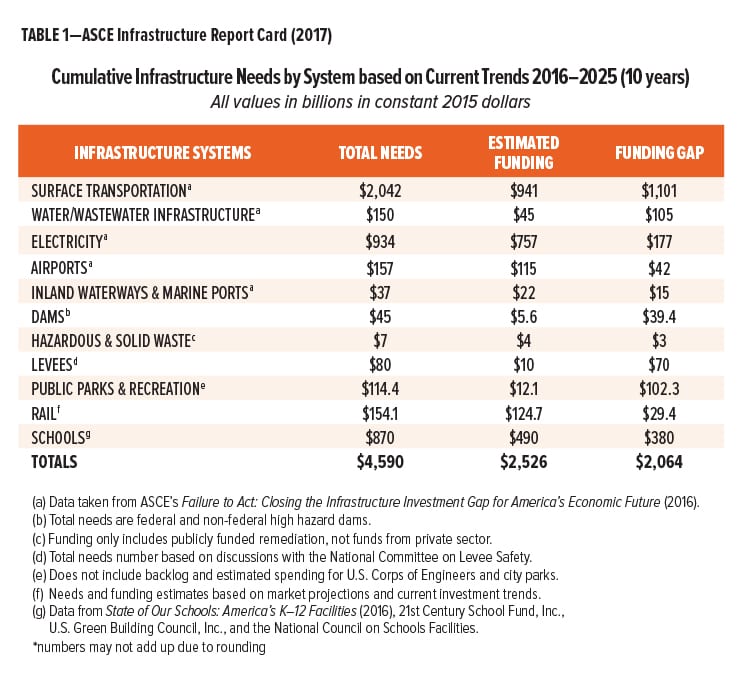
Recovery in the oil & gas sector is not likely in the near term; domestic exploration continues to experience a slowdown. Pent-up demand for restoring deteriorating infrastructure systems on which every mode of transport depends—including surface transportation (highways, bridges, commuter rail, transit), the rail network, airports, and inland waterways and marine ports—is not easing due to a persistent lack of public funding at the local, state, and federal levels. In its 2017 Infrastructure Report Card, the condition of the nation’s infrastructure once again earned a D+ grade by the American Society of Civil Engineers (ASCE). ASCE outlined a total funding gap of $2 trillion through 2025 for addressing deteriorating infrastructure, which includes a $29.4 billion funding gap for the rail network, shown in Table 1. According to the ASCE, the private freight rail network carries one-third of U.S. exports and five million tons of freight per day and owns the majority of the nation’s rail infrastructure. The AAR’s 10-year statistics on freight railroad capacity and investment (2007–2016) will follow, along with its freight shipment projections through 2045.
This article examines freight rail spending, shifts in the type of cargo being hauled by rail, a breakdown of railcar coatings technologies currently in use (and the corresponding critical unmet market needs)—and the demand for new car builds in addition to cyclic repairs (and retrofitting) of rail rolling stock that, by extension, drive the demand for protective coatings and linings.
Transporting Crude Oil by Rail
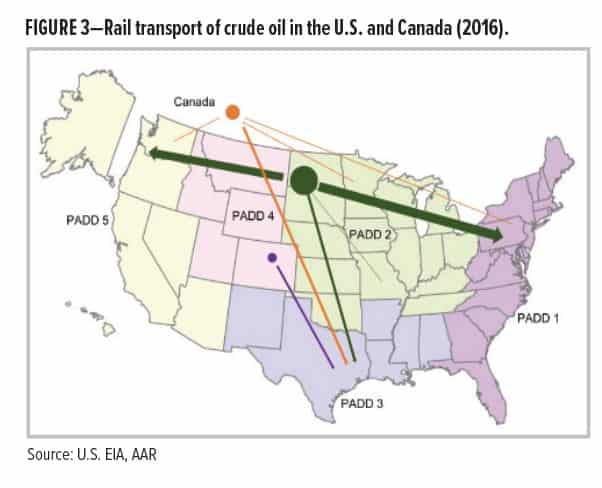
Crude oil must be transported to refineries either from domestic production sites such as Texas, Oklahoma, Louisiana (and the new site in the Bakken Shale region of North Dakota), or from the coastal regions where imported oil is transported by tankers (mapped in Figure 1).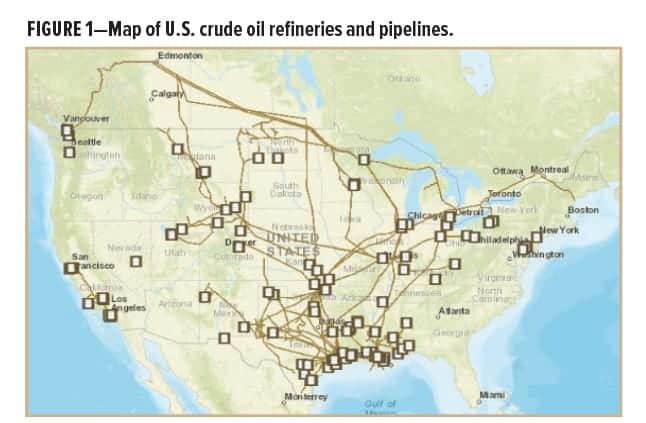
Historically, pipelines served that purpose until higher crude oil production outpaced growth in crude oil pipeline capacity—such as in North Dakota—at which point the freight rail network was leveraged to fill the gap.
Tank cars that carry crude oil have varying capacity ranging in size, according to one railcar manufacturer, from 13,000 gallons up to 33,000 gallons. The filling rates depend on many factors including the source of the oil, the type of tank car used, and the season of the year. On average, one carload of domestically produced crude oil carried about 700 barrels of oil in 2016, totaling 407,000 barrels of oil transported by rail per day, or just under 5% of total crude oil production that year. At the peak of the crude oil supply boom in 2014, 11% of domestically produced crude oil was transported by rail.
In 2016, the U.S. Energy Information Administration (EIA) estimates that ~4.25 million barrels of crude oil were produced per day from tight oil resources, which represented about half of total domestic crude oil production. Crude oil produced in the Bakken Shale region is transported to refineries in the Midwest and has accounted for the majority of rail crude oil originations in recent years. In 2014, the rail share of transporting crude oil produced in North Dakota averaged 62%, but by 2016 had sharply decreased to 32%. Conversely, pipeline share grew from 31% in 2014 to 57% in 2016. Over a 10-year period, pipeline capacity for transporting crude oil produced in the Williston Basin in North Dakota increased from 170,000 barrels per day in 2007 to 1.2 million barrels per day by 2017.
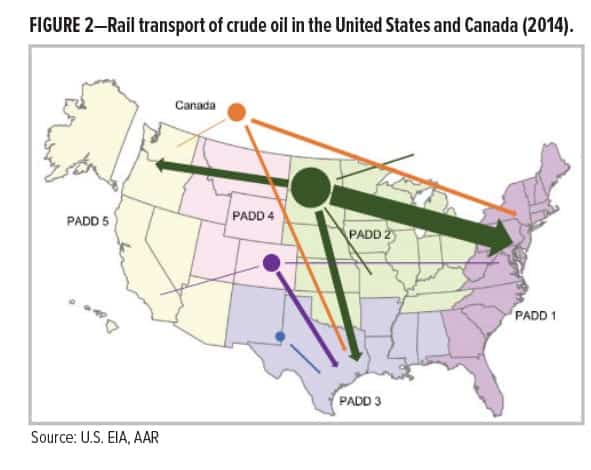
The EIA illustrates with maps annual movements of crude oil on the rail routes of five U.S. Petroleum Administration for Defense Districts (PADDs). Figures 2 and 3 contrast rail movements between 2014 and 2016.
Shifts in Commodity Freight by Rail
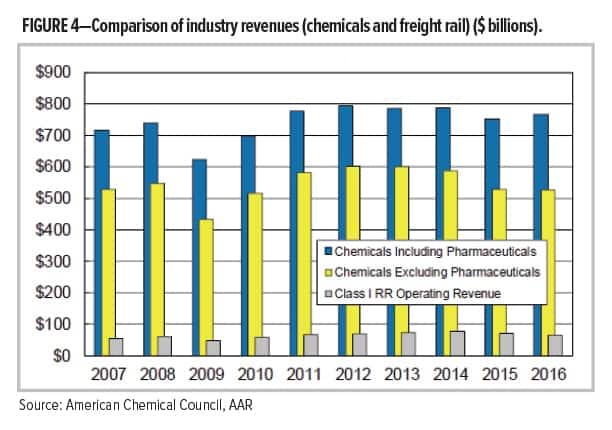
The American Chemical Council (ACC) commissioned a third-party survey of 68 small-, medium- and large-volume shippers of chemicals to better understand their respective shipping and logistics challenges in lieu of a chemical manufacturing renaissance that is underway. In March 2017, ACC findings revealed that 61% of chemical shipments were transported by truck, 24% by rail, 14% by marine container, and 1% by other modes of transportation. Revenue generated by rail chemical traffic for a 10-year period is depicted in Figure 4 (the demand for chemicals is closely tied to the U.S. economic outlook).
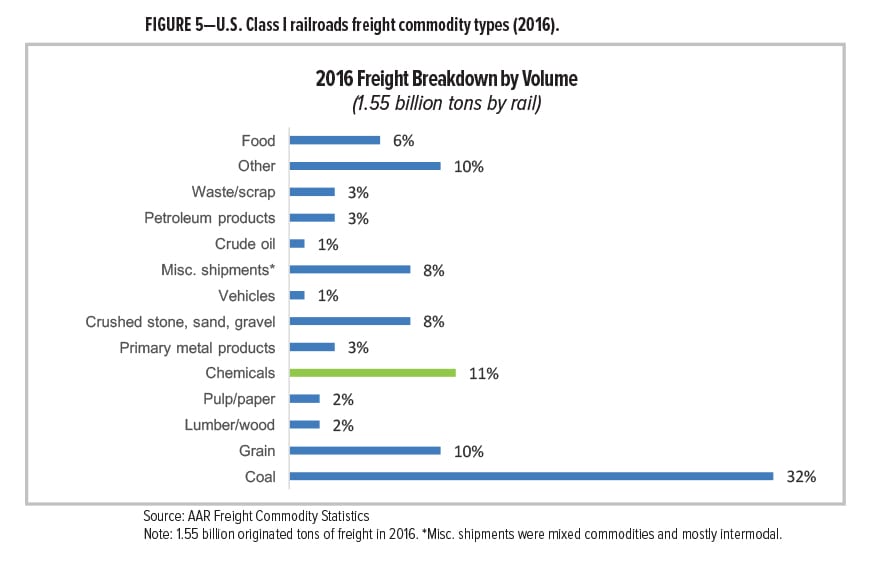
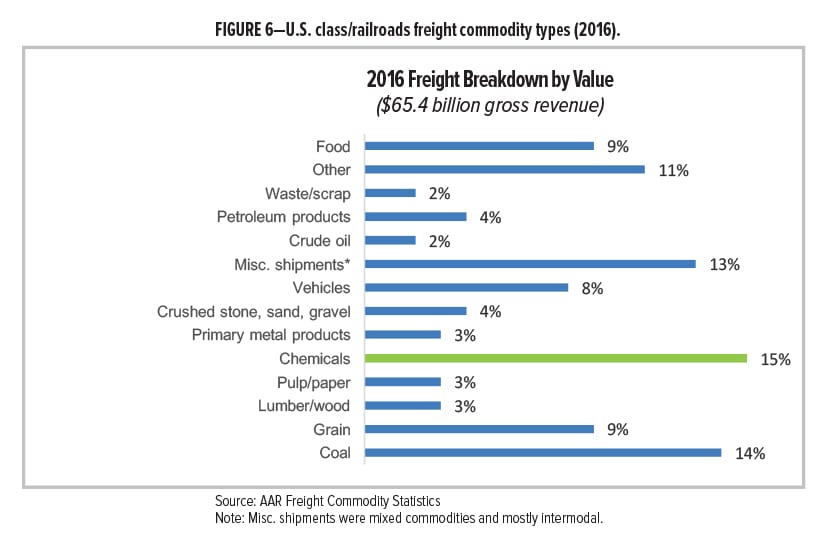
Historically, coal has been important rail cargo by volume and value. In 2016, 174.4 million tons of chemicals originating 2.1 million carloads were transported by rail, including organic/inorganic chemicals used for industrial purposes (53%); plastic materials and synthetic fibers (27%); and fertilizers and other agricultural chemicals (20%). Combined, those three chemicals categories represent less than half of chemicals produced in the United States. The highest-volume chemical carried by rail is ethanol. In 2016, for the first time, gross revenue generated by transporting chemicals outpaced that of coal—$9.9 billion vs $9.1 billion, respectively. AAR’s Freight Commodity Statistics by volume and value are shown in Figures 5 and 6.
These industry statistics align with ChemQuest’s primary research: When asked to identify noteworthy shifts since 2015 in the type of rail cargo, coatings practitioners indicated that plastic pellet shipments were on the rise. Frac sand is also reportedly “coming back.” With a downward trend of crude oil production, the rail industry was poised to retrofit a significant portion of now-idle tank cars that had been carrying crude oil. Retrofitting tank cars to carry other types of freight would have included painting, with a certain percentage converted to a new fire-protected class allowing for more flexibility in car assignment. However, the high volume of retrofitting work for which the rail industry geared up has not yet come to fruition. Extending the service life of tank car linings for carrying molten sulfur, corn syrup, and molasses was cited as an unmet need.
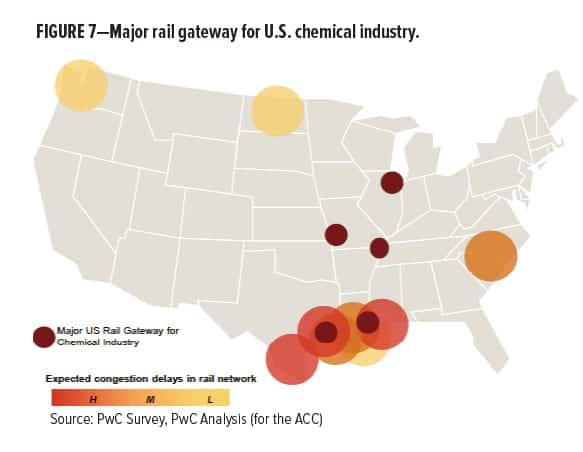
The 2017 Executive Summary Update of ACA’s Industry Market Analysis, 9th Edition (2014–2019) outlines the current feedstock trends that are driving growth in the U.S. chemicals industry. According to the ACC survey, 2017 and 2018 will be banner years with respect to increases in planned production volumes and new capacity. Additional shipments are anticipated for olefins (gases primarily transported by pipeline), polyolefins (processed into inert plastic pellets prior to shipping by a variety of transportation modes), and methanol (transported as a bulk liquid). Transporting an additional 16 million tons of chemicals by rail every year, given the current state of U.S. infrastructure and congestion-related delays, is of paramount concern. An additional 270,000 railcars may be required to ship an annual increase of 16 million tons of chemicals by 2020 (plus 23,000 new railcars that are needed to mitigate existing delays, according to ACC’s estimate). The Gulf Coast will be heavily impacted due to a concentration of chemical plants and rail congestion reported in that region, and to a lesser extent so will the states of Washington and Pennsylvania (as mapped in Figure 7). While the trucking industry has its own challenges related to a persistent shortage of qualified truck drivers (and new and existing delays on local and interstate highways), it is a viable alternative to freight rail, if needed.
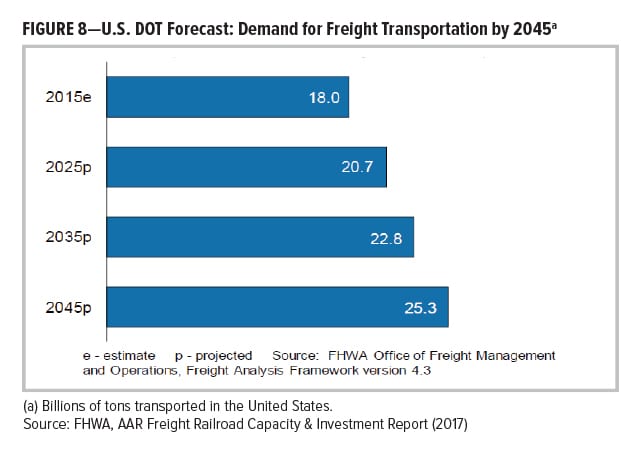
Since 1980, freight railroads have collectively invested $635 billion in private funds to create today’s freight rail network to include capital expenditures and maintenance expenses for locomotives, freight cars, tracks, bridges, tunnels, and other infrastructure and equipment. The U.S. Department of Transportation (DOT) has forecast a 41% increase in transporting freight (2015–2045) as shown in Figure 8.
While long-term projections for freight capacity are favorable, the rail industry has witnessed a dramatic decline in new railcar builds since 2014. The estimated decline of new car builds from 2015 to 2016 was 25%. For that same period, the AAR cited a 17% decrease in capital spending and maintenance on infrastructure and equipment. Even bleaker is the consensus among coatings practitioners: The 2017 forecast for new car builds has been cut in half over 2016, largely based on actual results reported in the first half of the year.
Not surprisingly, this 2016–2017 decline in new car builds is attributed to the collapse of domestic crude oil prices that resulted in smaller crude oil producers shutting down oil wells, reduced drilling and lower rig counts, and pipeline capacity that was added between 2015–2016. The net effect was an overall decline in rail traffic (lower demand for transporting petroleum, coal, and frac sand). The general make-up of existing railcar fleets is outlined below, along with a short-term forecast made by interviewees:
- The demand for tank cars fluctuates due to reasons previously discussed but overall growth is expected;
- There is a growing demand for high-capacity grain cars, auto racks, and plastic pellet cars (validating the ACC’s findings, some interviewees noted that certain pellet producers are planning to build new plants to add capacity, while others have noted that gains in the plastic pellet car market fell short of industry expectations);
- Class 1 railroads have increased carrying capacity through the operation of double stack containers. Another recent innovation is a convertible-deck auto rack that allows auto carriers to transition between bi- and tri-level racks instead of being forced to choose between them (bi-level racks accommodate larger vehicles such as SUV’s, trucks, and crossovers);
- Grain hoppers and some specialty gons (a type of open hopper car for hauling scrap steel and waste) and flatcars are very low;
- Maintenance work including relines plus exterior painting for hopper cars mostly assigned to carry plastic pellets is ramping up in some shops and will continue to rise through 2019;
- Some shops are almost working at capacity, while others are expanding by adding capacity for handling railcar linings for the first time;
- Pressure differential (PD) hopper cars are gaining momentum;
- Requalification work is expected to be in higher demand in 2018;
- It is anticipated that the rate of new car builds will reach 40,000, if not in 2017, then by 2018;
- New Tier 4 Locomotives are still being purchased but it is slowing;
- In terms of the fleet, demand for new boxcar builds is flat and not likely to recover.
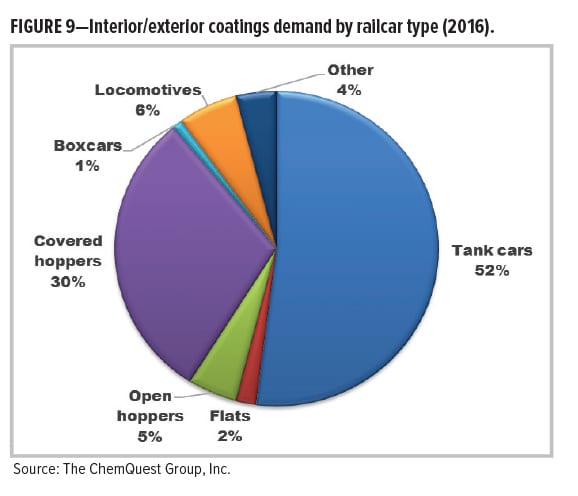
Demand for coatings and linings by railcar type changes from year to year (Figure 9 represents 2016 demand).
Current Trends in Railcar Coatings
Repair and general refurbishment work is predicated on several factors and thus it does not follow a predictable cycle. According to the AAR’s 2017 Field Guide for Tank Cars and its 49 CFR 180.509 standard, the interval between car inspections cannot exceed 10 years but that mandatory inspection does not necessarily translate into a great deal of maintenance painting. Mechanical repairs that are authorized in 10-year inspections are mandated by safety protocols (complying with AAR regulations). A decision to paint when safety is not a factor is based on scheduling (i.e., can we afford to have the cars out of service right now?) and financial justification.
Coatings usage is typically based on a ratio of one gallon of paint per 1,000-gallon capacity of a tank car. As previously mentioned, tank car capacity ranges from 13,000 to 33,000 gallons. At the lower end of the spectrum, a 13,000-gallon tank exterior may require 15 gallons of paint. Nineteen gallons of paint may be required for the exterior of a 19,000-gallon capacity tank car, while a 20,000-gallon car may use between 19 and 28 gallons of exterior paint, allowing for additional paint for the detail work on the A-end and B-end of the car (e.g., pipes, gratings, brake equipment, etc.) The largest tank cars with 33,000-gallon capacity may use a little less than the 1:1000 ratio, depending on the cargo type, coatings specification, and due to application efficiency.
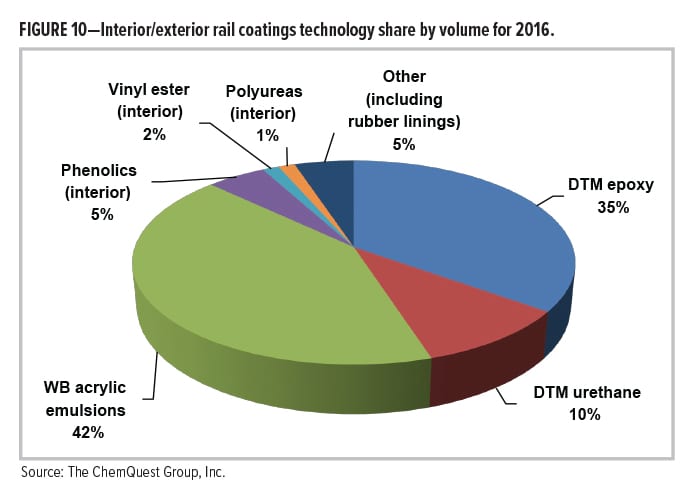
Direct-to-metal (DTM) epoxy continues to be the dominant technology used in exterior applications by railcar builders and lessors. With that said, a trend toward DTM urethanes at the expense of DTM epoxies was validated. Unlike epoxy technology, DTM urethane reportedly does not chalk and thereby increases life expectancy of coatings: Car exteriors painted with DTM urethane 10–12 years ago are still in good shape. As previously noted, the service life of exterior coatings applied to the top of tank cars is of special concern due to unmitigated UV exposure. Apart from using DTM urethane as a defense against chalking, some practitioners are increasing millage of DTM epoxies from the standard 4 to 6 mils to 6 to 8 mils (with the higher millage sometimes over just the tops of cars). While there is more of an upfront per-gallon cost for DTM urethanes, its total life cycle costs are lower when comparing 4 to 6 mils of both coating technologies. The trend toward higher millage (6 to 8 mils) of DTM epoxy in a side-by-side comparison to the standard 4 to 6 mils of DTM urethane will likely yield comparable service life, and may simply come down to per-gallon cost of the higher millage DTM epoxy vs standard mil DTM urethane. That lifecycle analysis is underway. Surface preparation methods and costs are the same for both coatings types.
Typically, surface preparation consists of blasting to bare metal:
- SSPC-SP 6 Commercial Blast Cleaning is standard surface preparation for exterior coatings
- Linings require a minimum of SSPC-SP 10, Near-White Blast Cleaning for a hopper car, and SSPC-SP 5, White Metal Blast Cleaning for a tank car.
There are differing opinions among practitioners when discussing overcoating exterior paint practices. In some maintenance painting operations, overcoating (instead of blasting to bare metal and applying a new coating) the car’s exterior paint has been cited as a preferred method with acceptable results. Overcoating was cited as “very successful in minimizing maintenance painting costs of certain fleets of cars such as boxcars, hoppers, and tank cars in mild service environments.” More of this type of overcoating is being performed. In at least one instance, the caveat of using only Novolac epoxy technologies in overcoating was a requirement for successful results. In some shops, overcoating is deemed as, at best, only a good “short-term” fix but not cost-effective over time. Blasting down to bare steel followed by the application of a full coating system mitigates against relying on the original coating system of a 6-, 10-, or 12-year-old railcar because that original coating may be the weak link that causes a premature failure when overcoated. Overcoating also reportedly adds internal stresses as the paint becomes thicker and thicker, which can result in a failure. At some point in time, numerous layers of coatings must be blasted off, which will result in high labor costs, creating messy and expensive waste to clean up and dispose of, at the expense of the shops.
A breakdown of interior/exterior coatings technology used in the rail industry is shown in Figure 10.
Unmet Market Needs in Railcar Coatings
The coatings industry has a persistent unmet need for tank car linings with a longer service life that carry molten sulfur, molasses, or corn syrup, and for rubber linings used to carry hydrochloric acid (HCL), phosphoric acid, and ferric chloride. Likewise, a replacement for high-bake phenolics has been needed for many years. Longer lasting rubber for exterior parts on tank cars that carry HCL was also identified as an unmet need for resistance to HCL spillage, especially due to UV exposure that reportedly shortens rubber’s service life.
- The industry has needed a longer lasting corn syrup lining due to the use of steam coils that can prematurely break down the linings. Current corn syrup linings’ service life reportedly ranges from 6 to 10 years. As one respondent noted, new lining systems have recently become available for corn syrup, but shippers tend to be reluctant to try new technology until it is vetted elsewhere. Due to the consumption of corn-based foods varying from year to year, in recent years there has been a lower demand for corn syrup cars, so the need for a longer-lasting lining is less of a priority right now.
- Conversely, one 30-year veteran in railcar coatings has seen a surge in molasses service. Carrying molasses poses challenges to lining systems because it is thicker and requires higher temperatures. The service life of a lining system for molasses is less than five years, depending on the type of molasses. There are different forms of molasses, each with varying thickness and viscosity. High temperatures required in the unloading process of molasses result in the car’s heating coils putting stress on the lining system.
- There is not a consensus on plastic pellet linings. Like molasses, there is a much higher demand for plastic pellet linings. While a longer lasting lining was cited as a need in some shops, two types of linings were identified with adequate service life for plastic pellet cargo:
—A single coat 100% solids epoxy lining that has a very long, successful field history of excellent service in plastic pellets;
—A two-coat, high solids epoxy lining that also has a long history of successful service in plastic pellets. - With respect to the service life of molten sulfur linings, varying lining methods and types have been used over the years with best results obtained through superior application procedures as well experienced applicators. Most of the early failures in molten sulfur service had stemmed from inadequate surface preparation and poor application of the lining, resulting in shorter-than-expected service life.
Yet a molten sulfur-resistant lining with better life expectancy is still cited as an unmet market need. Current life is said to be in the three- to five-year range. As a benchmark, other types of linings’ service life range from 8 to 10 or 15 to 20 years, depending on many factors. Rubber linings can last longer depending on conditions.
Rubber linings are specified for specific conditions, including:
— When hauling very aggressive, corrosive materials;
— For cargo that is ultra-sensitive to iron contamination;
— For HCL that is used in the fracking process (rubber-lined blend can also work);
— For hauling phosphoric acid, which is used as a flavoring agent for carbonated beverages such as Coca-Cola®, beer, and certain foods, and in the manufacture of fertilizers, detergents, and pharmaceuticals;
— For hauling bleach, a high-commodity freight item.
- For many years, there has been a reluctance to test and use low-bake linings as a substitute for high-bake phenolics that are by some accounts widely overused. Although the low-bake alternative is suitable for specific cargo, its range of suitability has widened in recent years, at half the cost of high-bake phenolic linings. (Phenolic interior coatings sell for approximately $60–$70 per gallon.)
Regulatory Update
On May 8, 2015, the Final Rule entitled, “Hazardous Materials: Enhanced Tank Car Standards and Operational Controls for High-Hazard Flammable Trains” (also known as the AAR’s HM-251 final rule), mandates that existing railcars carrying crude oil or ethanol must be retrofitted according to the DOT-prescribed retrofit design or performance standard for high-hazard flammable trains (HHFT). The HM-251 final rule issued by the Pipeline and Hazardous Materials Safety Administration and the Federal Railroad Administration applies to “a continuous block of 20 or more tank cars loaded with a flammable liquid or 35 or more tank cars loaded with a flammable liquid dispersed through a train.”
The prescribed car is required to have a 9/16-inch tank shell, 11-gauge jacket, 1/2-inch full-height head shield and thermal protection. In summary, this requirement translates to added insulation, increased tank thickness, and better fire ratings that are required for a hazardous cargo class. From a coatings perspective, the conversion requires new exterior paint and priming the inside of the jacket. The Final Rule was issued following fires that developed in tank cars carrying crude oil. Nevertheless, the scale of retrofitting work—which was built up as a boon for railcar coatings—has not yet materialized.
Closing Comments
The AAR reinvests about 19% of its private revenue on capital expenditures and maintenance for its infrastructure and equipment; nevertheless, the industry-wide tendency is to use minimal-cost coatings materials and methods to achieve acceptable results. With that said, the life cycle cost analysis that is underway to compare a standard DTM urethane coatings system to high millage DTM epoxies is unparalleled—especially for gaining superior chalking resistance, a coatings property that in previous studies had been identified as a much lower priority.
Given ACC findings on the renaissance of the U.S. chemical industry, the reshoring trend, and an uptick in automotive and light truck sales—combined with the U.S. DOT’s demand forecast for transporting 41% more freight by 2045—the rail industry is poised for sustained growth. By extension, so are rail rolling stock coatings used for new car builds and for retrofitting work. Innovative thinking for solving congestion-related delays and planning for future rail traffic growth will be important to capture rail’s share of the anticipated increase in freight movements.
Manufacturers are up to the challenge of helping freight rail customers remain competitive from a materials standpoint. As noted by a representative from one such company, Strathmore Products, “As a coating manufacturer we are continuously working with the rail car fabricators and repair shops to find ways to improve the application coating efficiency and provide the owners with a quality, high-performing, finished product that protects their assets meeting all the environmental requirements during the coating application.”
The Executive Summary Update of 2017 includes many other projections and insights for the coatings sector. For information, visit paint.org/publications-resources/market-analyses-benchmarking/aca-industry-market-analysis/.
CoatingsTech | Vol. 14, No. 10 | October 2017