
By George R. Pilcher, The ChemQuest Group, Inc.
The Great Supply Chain Crisis of 2022 alerted the entire world to the fact that something had changed in the relatively static global trading dynamic, and that it was highly unlikely to be a portent of good things to come. At a time when many people, enterprises, and governments were thinking to themselves, “that can never happen again,” ChemQuest was losing no time advising its clients that not only could it happen again, but that it would happen again. The question was never, “Will such a supply chain disaster ever occur again in the future?” but rather, “When will the next supply chain crisis hit the global manufacturing network?” Four years later, we cannot help but notice that the world is a less friendly place than it was in 2022—a less friendly place with a less robust global supply chain that is more easily affected than ever by the inevitable disruptions imposed by geopolitics, and all that this baleful concept implies.
To be fair, a lot was learned from the Great Supply Chain Crisis, and a lot of the learning that was applied to the various areas of business, government, and global cooperative organizations was of a very positive and proactive nature and certainly helped to stabilize the global supply chain going forward. Actions of all form and description were taken to prevent another Great Supply Chain Crisis in the future by businesses, both small and large; local and state governments; governments of countries around the globe; cooperative organizations such as the World Bank; and global non-profit organizations such as the Red Cross. For those with strategic vision, it was imperative to do whatever was necessary to avoid wreaking havoc with the complicated arteries of commerce that carry the lifeblood of the global economy in them.
For the three years immediately following the crisis, conversations across the globe were dominated with “What if?” questions—the very type of questions that Franklin Delano Roosevelt very famously, and quite adeptly, sidestepped by indicating that he never answered them. Few people have ever been in a position to dismiss questions in the manner of FDR, however, so the “what if?” questions surrounding the post-COVID/Great Supply Chain Crisis period abounded, and while many fell on fallow soil, others produced a harvest of scenarios that either have proven—or may prove in the future—to be helpful in dealing with what is going to remain, for the foreseeable future, a fragile global trade structure dominated by geopolitical concerns. Let’s be honest, however—there are still ongoing tariff issues that must be resolved; the war in Ukraine continues four years after a “3-4-day victory” by Russia was largely seen as a “given”; the Strait of Hormuz is an example of economic whiplash that is not likely to go away anytime soon; cybersecurity controls and all that this phrase implies will continue to haunt us; the persistent political instability in oil-producing nations like Libya, Venezuela, and Nigeria threatens sudden, unexpected drops in local production, exacerbating global supply chain friction; the Houthis are still capable of causing chaos, whether in the past in the Red Sea or now in the Gulf of Aden; the Israeli-Hamas, Israeli-Hezbollah, Israeli-Iran conflicts are not going to admit of solutions on any reasonable time horizon; and AI inspires fears of impending existential crisis. We live in world alive with conflict, and conflict of any type, to any degree, negatively affects supply chain stability.
While it is true that the oil-producing countries of the Middle East are allocating billions of dollars to create alternate pathways for their crude to bypass the Strait of Hormuz on its way to market, these measures, while significant, can only deal with currently known threats. “What we don’t know that we don’t know” will always be lurking around the corner to create the next supply chain disruption, so it doesn’t make sense to build the new pipelines and ports and then breathe a sigh of relief. . .this would not be a realistic view of the world in which we currently live and isn’t going to improve in any substantive fashion tomorrow or the next day.
We are seeing the early stages of what are likely to become major shifts in global trading scenarios in the years ahead, with regard to “who trades with whom” and how this will affect global regional trading patterns. While it is possible to posit the creation, but impossible to predict the certainty, of a number of scenarios regarding what these shifts might look like, it is reasonable to assume that two popular scenarios involving either national/regional self-sufficiency or a return to the rules-based trade model that has been in effect for the past several decades are not likely to become the “new norm.” Instead, it seems more likely that trade will move forward along the lines of one of two models1:
- A multi-nodal trade patchwork characterized by free-trade oriented countries seeking to deepen their trade; BRICS+2 (excluding China) deepening trade; U.S. and China prioritizing domestic objectives. These would basically be governed by corridor-specific rules.
- Regional strongholds would develop in which North America, Europe, and Asia-Pacific defend their internal markets; “insider” free trade agreements would boost intrabloc flows of goods; outsiders would face higher trade barriers.
Of these two more likely models, the “patchwork” scenario strikes the writer as the scenario more likely to evolve over the coming decade. Under this model, for example, it would be logical to assume that the globe would be divided into four nodes of global trade that would look something like this:
- United States—“America First” policy approach
- China—Prioritization of access to supplies of key materials
- BRICS+ (minus China)—Prioritization of trade as a vehicle for growth, and emphasis on national sovereignty over integration
- Plurilateralists3—Characterized by rules-based free trade agreements and clear standards for market access
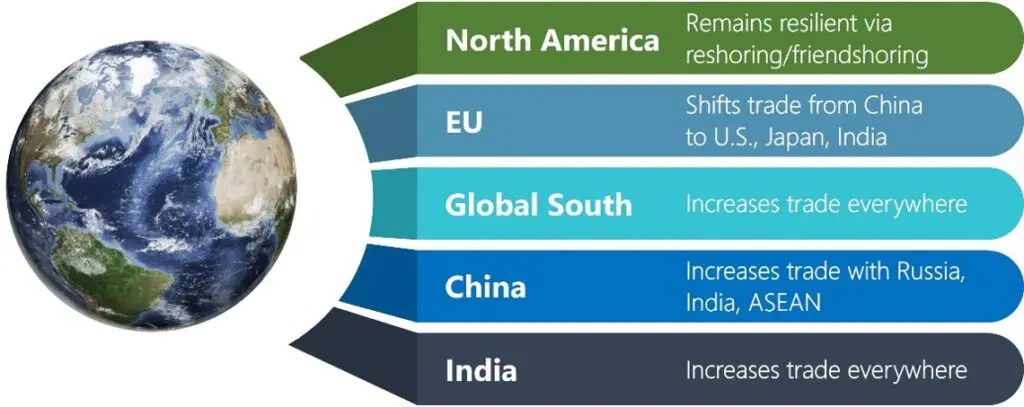
Regardless of which of the two scenarios emerges as the dominant mode of world trade, the following “high-level trade trends” can be anticipated to become operative on a global basis (Figure 1).
FIGURE 1: Anticipated world trade trends
Source: The ChemQuest Group, Inc.
The bottom line going forward is that global supply chains are more fragile than ever, and everyone in the paint and coatings industry must be diligent about applying the lessons that they learned from the Great Supply Chain Crisis of 2022 to everything that they are doing today, while also preparing to react as quickly as possible to news from around the world that might affect both the supply chain and their individual businesses. We are all going to need to consider some version of reshoring (and/or nearshoring, friendshoring, ally-shoring) to secure critical raw materials and control the cost of shipping. It will be more important than ever to have multiple suppliers for our raw materials whenever possible—and it is vital that every paint and coatings producer adjust both raw material and finished goods inventories to levels that enable the greatest flexibility possible when global supply chains are disrupted.
The Relationship of Crude Oil to the U.S. Paint and Coatings Industry, 2025–2026e
Understanding what is happening now and what is likely to happen in the near- and longer-term future of crude oil production is necessarily an important component of the creation of meaningful strategy for paint makers worldwide. We must always bear in mind that every $10 increase in crude results in a 3% increase in overall costs to coatings producers, representing an important factor in the overall dynamics and profitability of the paint and coatings industry.
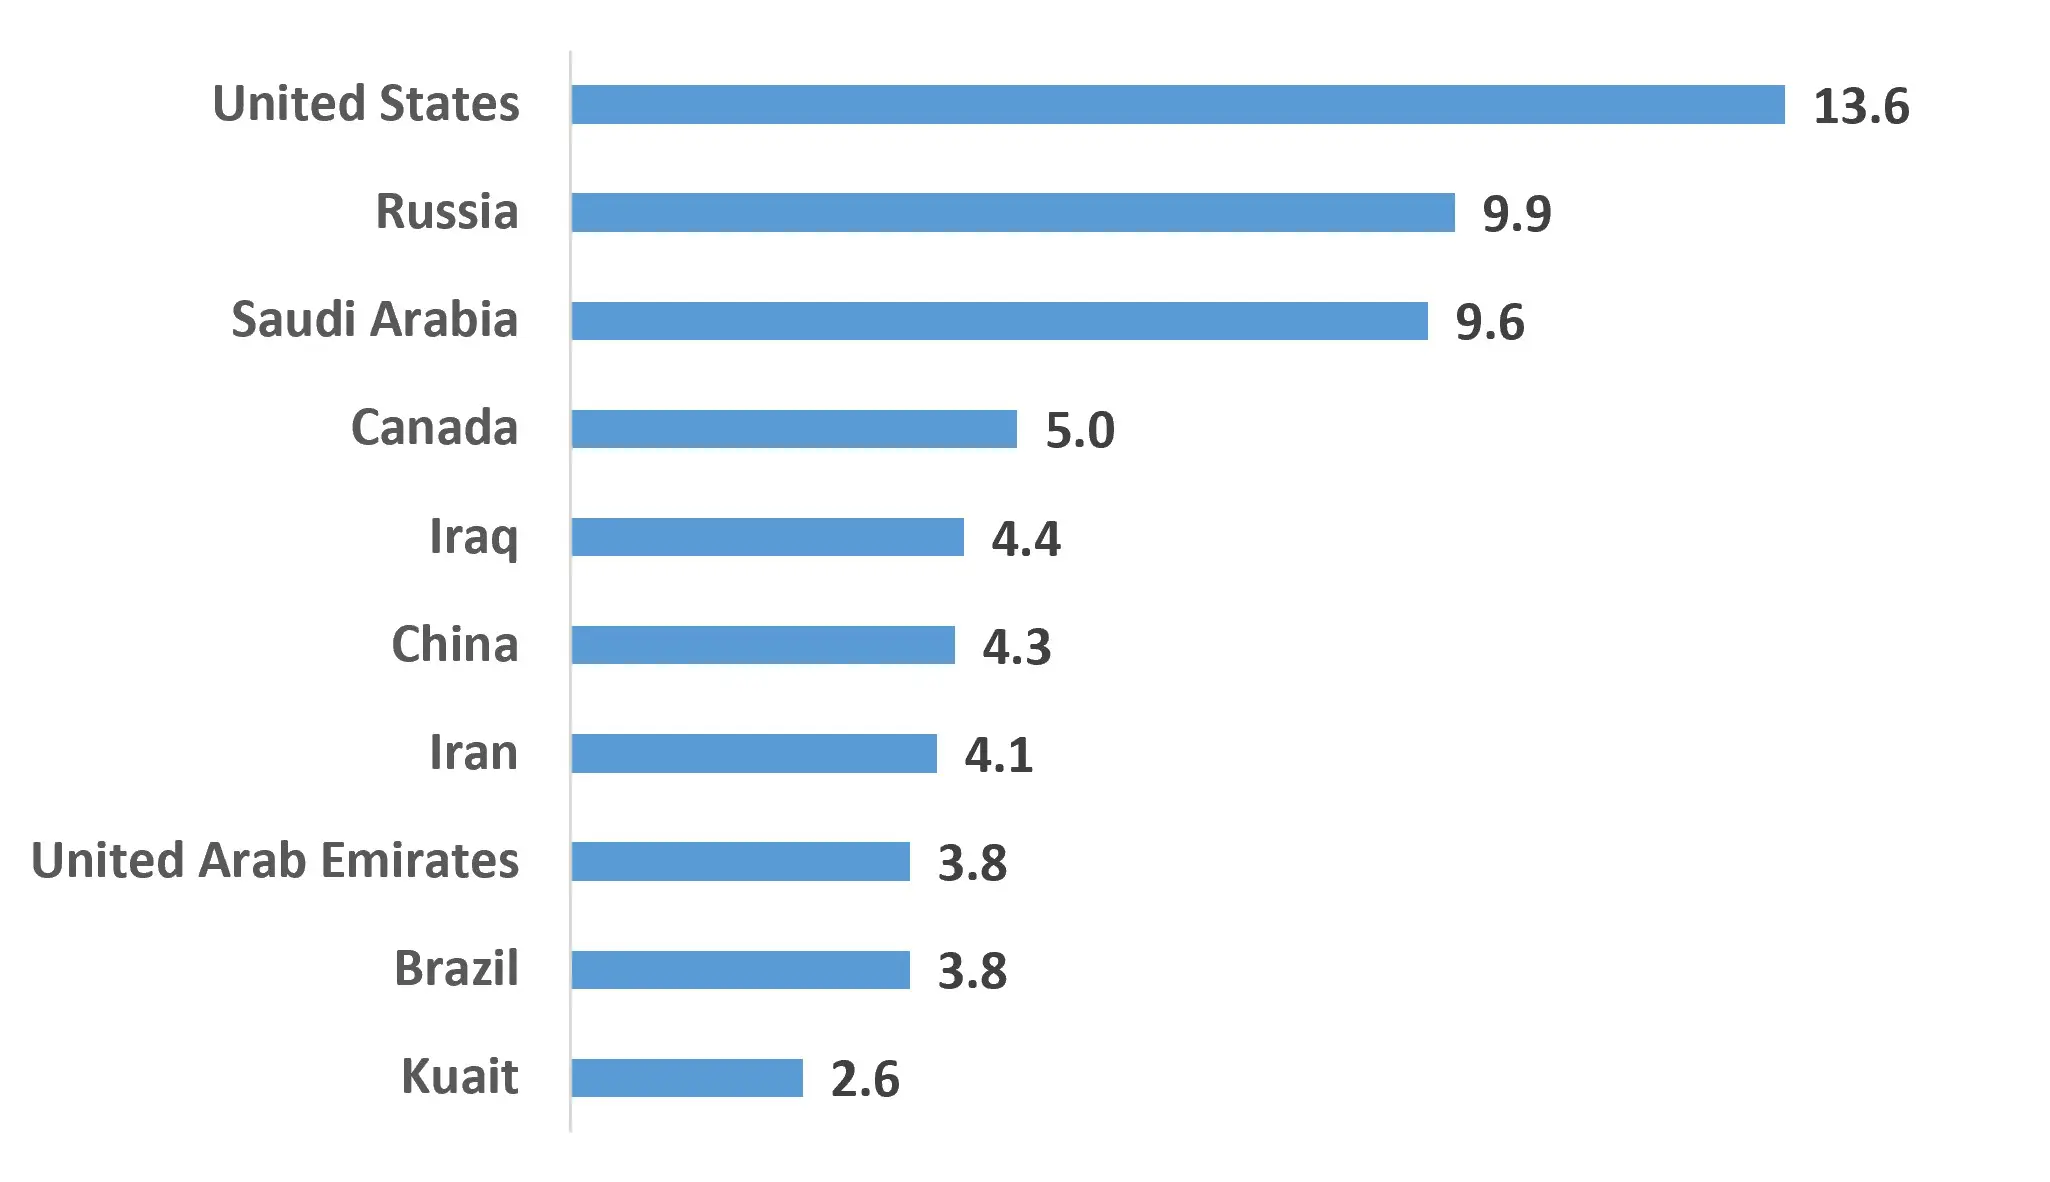
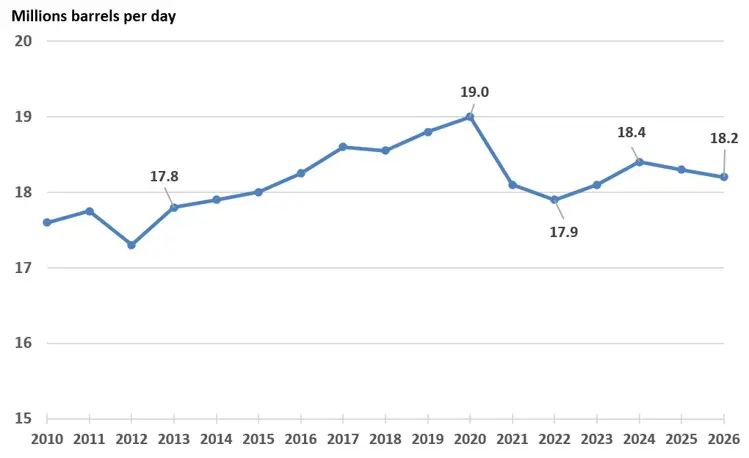
During 2025, the U.S. retained its position, achieved in 2018, of the largest global crude oil producer at 13.6MM barrels per day, significantly ahead of Russia (9.9MM barrels per day) and Saudi Arabia (9.6MM barrels per day)4 (Figure 2). This year, U.S. refinery capacity utilization is running at 90-96% of capacity, which is higher than the long-term average of 89-90%, with a slight seasonal dip at the beginning of each year.5 Over the last four years, refining capacity has remained in the range of 17.9-18.4 million barrels per day6 (Figure 3).
FIGURE 2: Top 10 global crude oil producers, 2025—millions of barrels/day
Source: The ChemQuest Group, Inc.; U.S. Energy Administration, International Energy Statistics
FIGURE 3: U.S. crude oil refining capacity
Sources: The ChemQuest Group, Inc,; U.S. Energy Information Administration
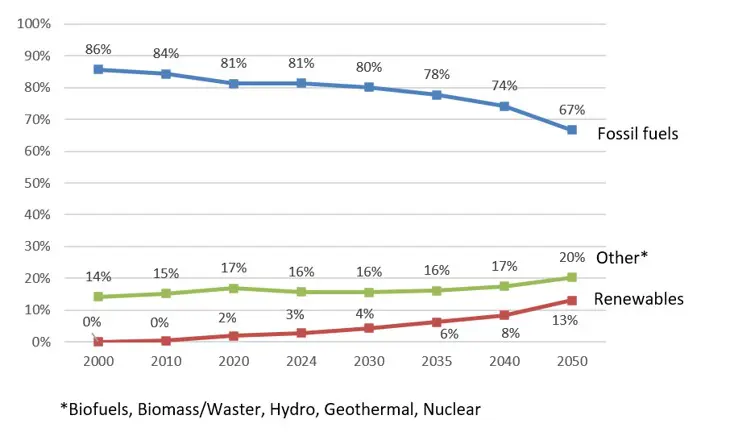
In the longer term, the percentage of energy from fossil fuel products will be in very gradual decline (roughly a decrease of 1% per year) between now and 2050, as low-carbon and renewable sources—nuclear, biomass, hydrothermal, geothermal, tidal and wave, and “solar thermal” (which is not to be confused with “solar”)—increase their share at a slightly greater rate of 3-5% per year (Figure 4).
FIGURE 4: Future sources of energy in the United States
Sources: The ChemQuest Group, Inc.; ExxonMobil
The State of the U.S. Paint and Coatings Industry, 2025–2027f
The author and The ChemQuest Group, Inc. closely follow the global paint and coatings industry in order to produce articles such as this, as well as various industry presentations throughout the year. In addition, our proprietary ChemQuest TraQr® resource provides us with access to regularly updated global market and economic information. Drawing upon the deep knowledge that is resident within ChemQuest’s databases, TraQr®, and experienced personnel, it is time to look at the “State of the U.S. Paint and Coatings Industry.”
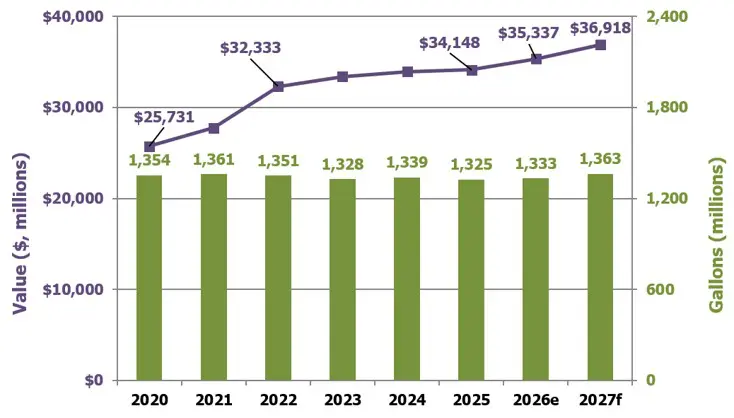
The U.S. paint and coatings industry is doing acceptably well, all things considered. Results through the first half of 2026e suggest a mixed outlook for the paint and coatings industry in the United States. The year 2025 ended with production of 1.33 billion gallons valued at $34.1 billion, up from 2024 by 0.6% in value but down by 1.1% in volume. The outlook for 2026e suggests a modest volume increase of 0.6% in full-year production, totaling 1.33 billion gallons, and an increase of 3.5% in value to $35.3 billion, as shown in Figures 5-7.
FIGURE 5: U.S. paint and coatings industry, by volume and value (2020-2027f)
Sources: The ChemQuest Group, Inc., estimates; ChemQuest TraQr®
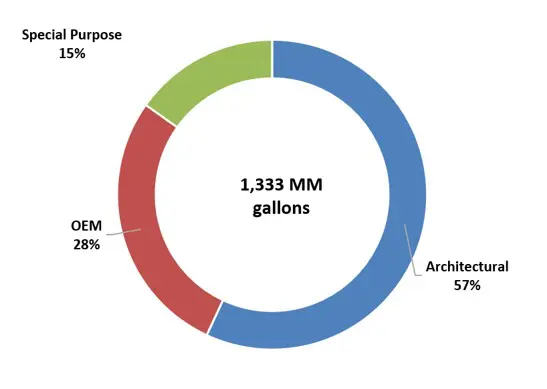
FIGURE 6: U.S. paint and coatings industry market segmentation, by volume (2026e)
Sources: The ChemQuest Group, Inc.; ChemQuest TraQr®
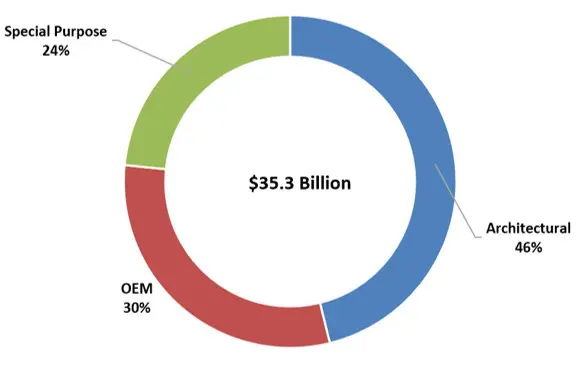
FIGURE 7: U.S. paint and coatings industry major market segmentation, by value (2026e)
Sources: The ChemQuest Group, Inc.
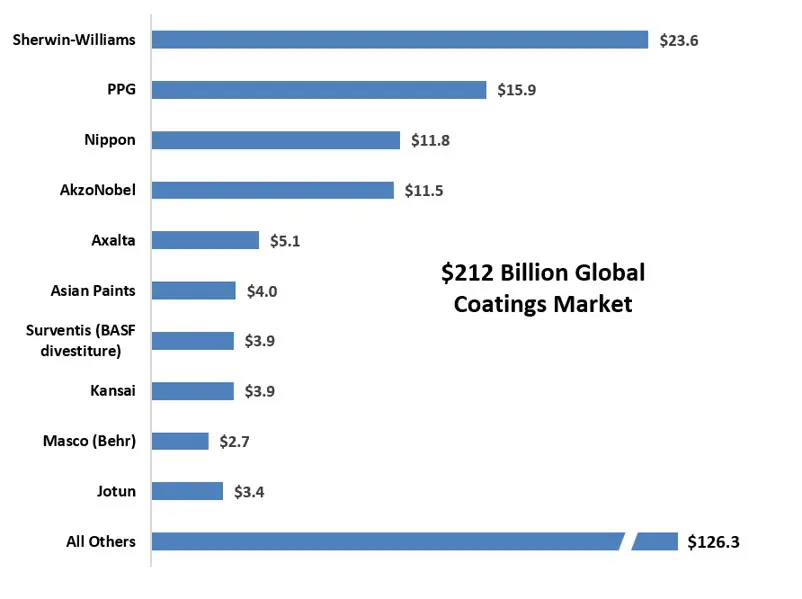
As a result of aggressive consolidation over the past two decades, the top 10 global coatings firms collectively account for 40.0% of global sales in 2025. Furthermore, the top four global players accounted for 73% of the top 10 global coatings firms’ sales in 2025 (Figure 8).
FIGURE 8: Top 10 global paint and coatings producers, by value (in $billions, 2025)
Sources: The ChemQuest Group, Inc., estimates
Architectural Paints
Architectural paint sales correlate well with the health of the housing/construction market. Within the U.S. coatings industry, the architectural paints segment in 2025 accounted for 57% of the volume (about the same as in 2024) and 46% of the value (also essentially the same as in 2024). We are projecting that volume of the architectural segment in 2026e will decline by 0.3%, although the value will increase by 1.9%, as previously shown in Figures 6 and 7.
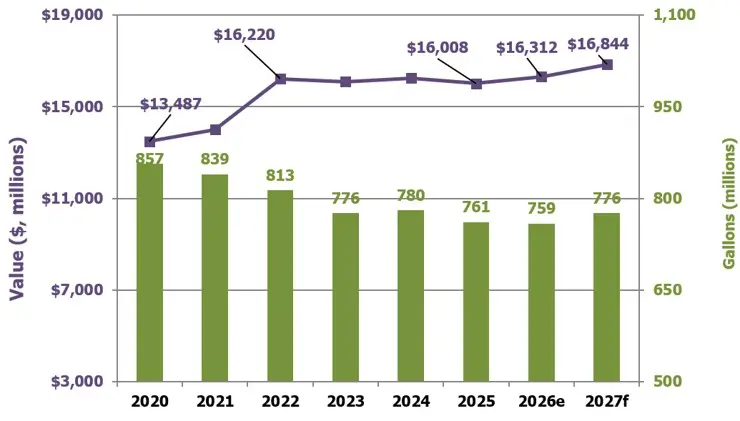
Looking forward to 2027f, we anticipate a volume increase of 2.2%, with a value increase of 3.3%, as shown in Figure 9.
FIGURE 9: U.S. architectural coatings market segment, by volume and value (2020-2027f)
Sources: The ChemQuest Group, Inc., estimates
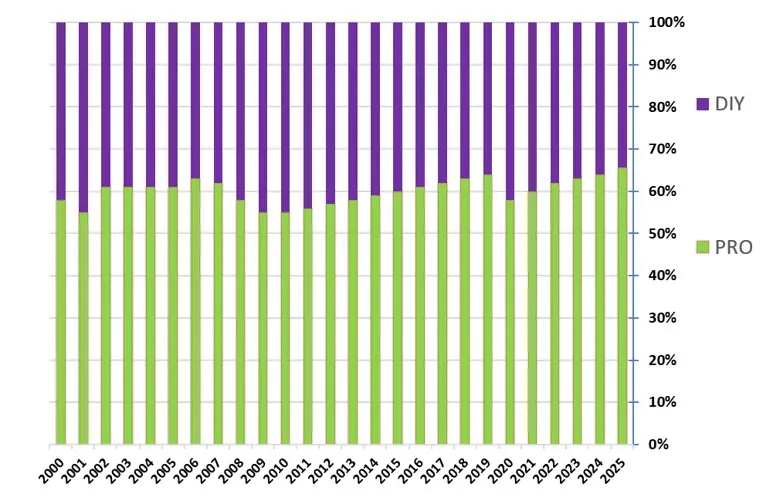
Over the years, the percentage of PRO-applied paint tends to rise and fall with both the housing market and the general economy. It increased steadily from 2010 through 2019 with the strong economy and then dropped significantly during 2020, as homebound consumers decided to purchase paint and apply it themselves rather than hiring a PRO to do it for them. Following the flurry of homeowner painting activity in 2020, however, PRO regained essentially all of the lost ground in 2021 through 2025. We anticipate that the ratio will increase slightly to 66% PRO:34% DIY in 2026e, helped by the need for maintenance painting on existing structures (Figure 10).
FIGURE 10: U.S. architectural coatings, PRO vs DIY (2000-2025)
Source: The ChemQuest Group, Inc.
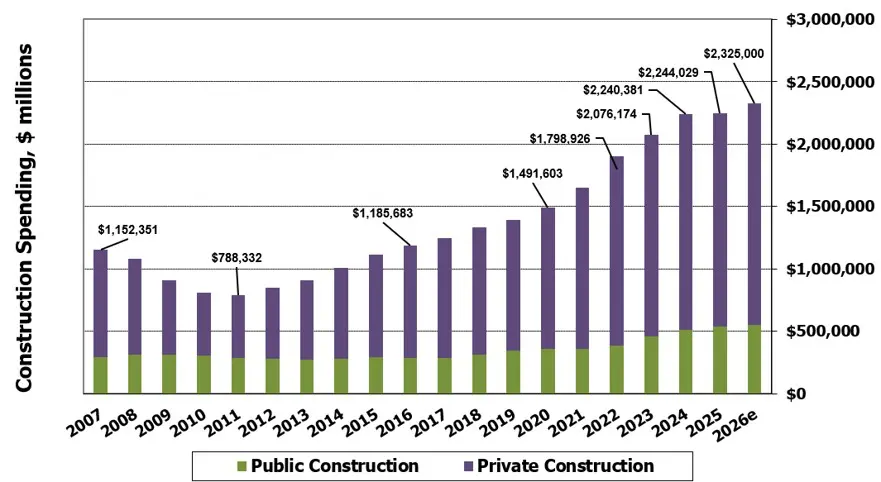
A major driver of the architectural coatings segment has historically been construction, which is closely correlated to coatings volume. Because U.S. construction continued its prolonged recovery from the unprecedented low point it experienced in 2011, this trend would traditionally be expected to be good news for architectural paints and coatings—and so it proved to be during the period 2020–2025. Year-over-year growth in construction spending for 2025 was only 0.2% but is anticipated to be higher (3.6%) during 2026e, for a total of $2.3 trillion. Despite concerns in some sectors about a potential recession, coupled with ongoing high interest rates and the steep growth in the cost of housing, we expect to see continued growth in construction, as shown in Figure 11.
FIGURE 11: U.S. construction spending—private, public, and total (2007–2026e)
Source: The ChemQuest Group, Inc.
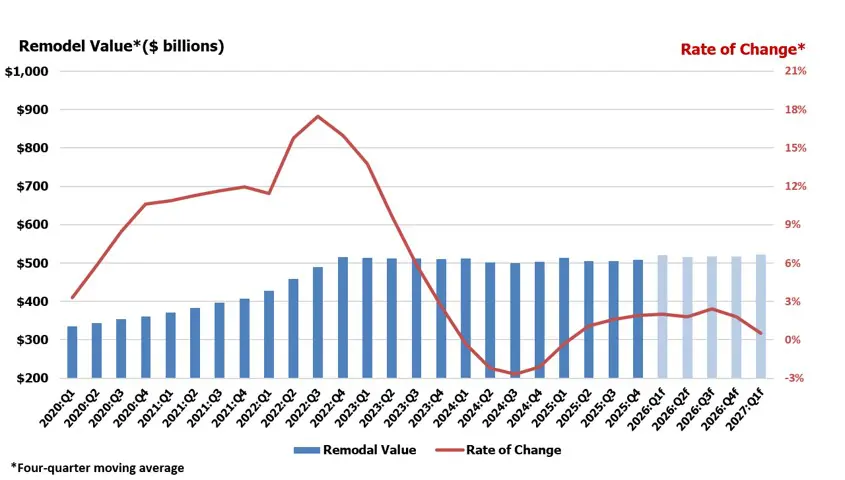
Ongoing issues surrounding housing availability and affordability continue to act as a headwind for the architectural segment, as does the recent consumer trend away from the premium-level paints to lower cost products, driven by consumer anxiety over the economy, in general, and inflation, in particular. Remodeling has always been an additional driver for the architectural coatings segment, and activity in this area is monitored by the Joint Center for Housing Studies of Harvard University’s Leading Indicator of Remodeling Activity (LIRA). As shown in Figure 12, the remodeling growth rate peaked at the end of 2022 but has declined since then, even entering negative growth in 2024. In 2025, very modest growth was observed. LIRA anticipates remodeling market growth through the remainder of 2026e to be about 2%, but it foresees some slowdown into the first quarter of 2027 (Figure 12).
FIGURE 12: Leading indicator of remodeling activity (LIRA), Q1 2022 through Q1 2027f
Sources: Joint Center for Housing Studies of Harvard University; The ChemQuest Group, Inc.
Industrial OEM
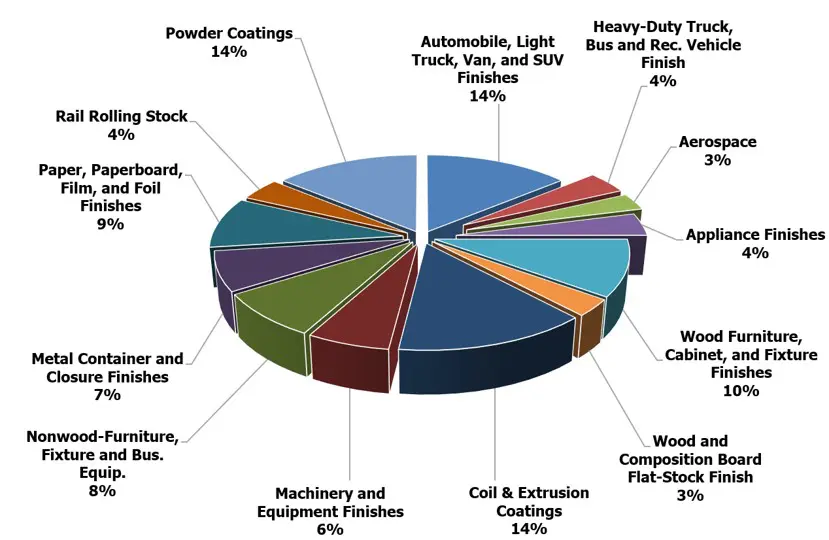
The industrial OEM segment consists of more than a dozen subsegments, the largest segments of which (by both volume and value) are automobile and light truck (including rigid and flexible automotive exterior trim systems and brake systems, et al.); coil and extrusion coatings; wood furniture and cabinets; and powder coatings (Figure 13). As a result of such a diversity of goods, the industrial OEM segment is driven by a variety of factors, although most are influenced by the macroeconomic environment and especially by industrial production.
FIGURE 13: Major subsegments of the U.S. industrial OEM coatings market segment, by value (2026e)
Sources: The ChemQuest Group, Inc., estimates
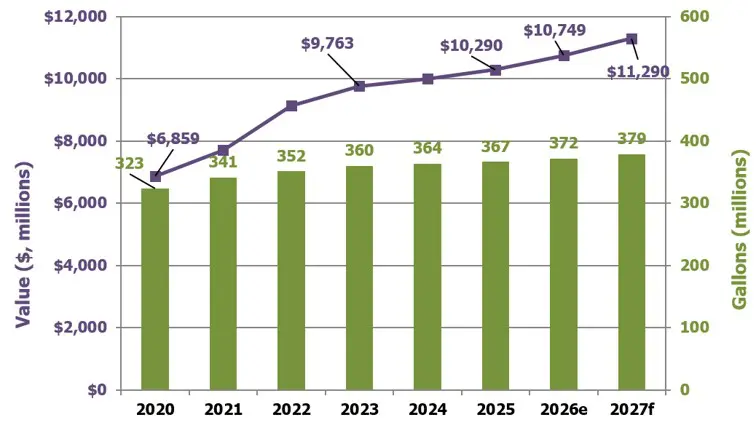
The U.S. industrial OEM coatings segment grew in value by 2.9% in 2025, generating $10.3 billion in sales while producing 367 million gallons. In 2026e, we expect to see an increase of 4.5% in value and 1.4% in volume, resulting in $10.7 billion in sales on 372 million gallons. Looking ahead to 2027, we anticipate continued growth of 5% in value and 1.9% in volume, as shown in Figure 14.
FIGURE 14: U.S. industrial OEM coatings, by volume and value (2020-2027f)
Sources: The ChemQuest Group, Inc. estimates
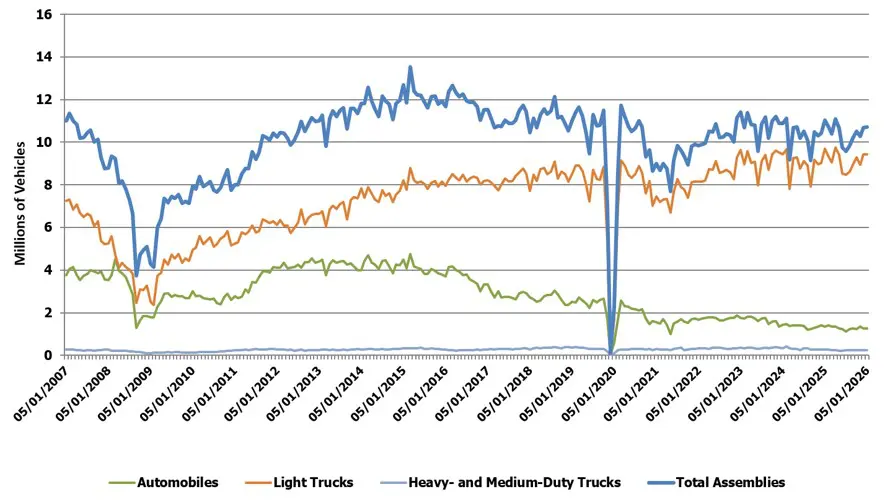
The automotive subsegment (defined as the total of domestic production, transplants, and imports of automobiles, light trucks, vans, and SUVs) peaked in mid-2015 and has not fully recovered.
From the shocking dip in September 2021 to the present, builds grew to 10.7 million units per month SAAR (seasonally adjusted, annualized rate), driven primarily by light trucks. Automobile (sedan) growth has been in a slow decline and is likely to remain that way throughout 2026e and beyond, given the increasing popularity of light trucks and SUVs (Figure 15).
FIGURE 15: Monthly U.S. total motor vehicle assemblies (May 2007–May 2026) SAAR
Source: The ChemQuest Group, Inc., St. Louis Federal Reserve
Harkening back to Figure 13, factory-applied coatings are divided over a number of markets, with two exceptions:
- Powder coatings comprise 14% of the OEM market, slightly lower than in 2025. While powder is an important coatings technology, it is not a market. A number of markets have gravitated to powder coatings over the years, including metal furniture, appliances, and automotive underbody, and powder is making incursions into extruded metal and a number of other market areas, as well. Powder coatings have largely replaced solventborne liquid coatings in “job shop” applications. Nevertheless, we believe that the use of powder coatings is nearing, or possibly at, maturity, and the combination of powders formulated for greater coverage, coupled with increased application efficiency, will slow its volume growth. From 2027 onward, we anticipate seeing flat, or even negative, growth in powder coatings.
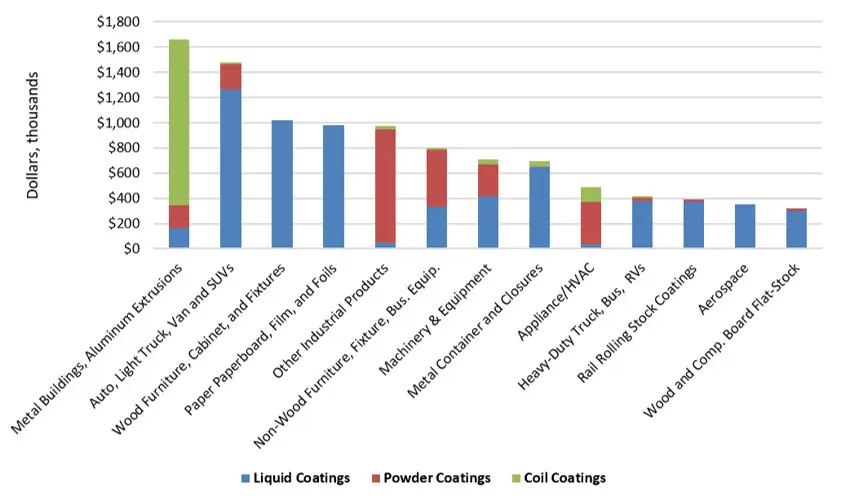
- Coil-applied coatings and spray coatings for extruded metal make up an additional 14% of the OEM market but have also reached maturity and are expected to exhibit flat growth for the foreseeable future. Coil coating is an application technique; its major targeted market area is metal building products, although it also has usage in appliance/HVAC, heavy-duty truck, bus, and RVs, as well as a few smaller areas. Spray-painted aluminum extrusions are most often used as a building product in conjunction with coil-coated metal, which is why this category is combined with coil coatings. It is helpful, however, to see the full array of market segments in which powder coatings and coil coatings are used, in the context of the major OEM industrial markets (Figure 16).
FIGURE 16: U.S. OEM coatings, with powder and coil coatings distributed into markets (2026e)
Sources: The ChemQuest Group, Inc., estimates
Trends in the industrial OEM market segment are driven by the desire for:
- Reshoring/nearshoring/friendshoring/ally-shoring certain raw materials to reduce dependency upon imported materials, especially those from regions of the world that are beset by political unrest
- Creating operational efficiencies (e.g., increased productivity, reduced labor, or decreased cycle times)—fewer coating layers, thinner coating layers, greater availability of wet-on-wet systems
- Increased sustainability (e.g., reduced CO2 footprint and product end-of-life reuse/disposal) and incremental product improvements (e.g., greater infrared reflectance on roofing panels and reduced cabin noise in vehicles)
- Robust functionality—ability to coat mixed-material substrates, composites, alloys, and other non-traditional surfaces that are being increasingly used for the purpose of lightweighting vehicles and equipment and to impart unique structural properties
- Innovation—self-healing and self-cleaning coatings, self-stratifying coatings, coatings with “pollution-gobbling” properties, coatings that respond to stimuli by altering their properties (“smart coatings”), burnish- and scratch-resistant matte coatings, coatings with solar heat management capability, coatings with print-friendly surfaces, etc.
- Design and customization—increasing interest in made-to-order coatings to provide consumer engagement and for industrial coatings companies to differentiate themselves on both products and services
Special Purpose Coatings
Automotive refinishing, industrial maintenance/protective coatings, traffic-marking paints, marine coatings, and aerosol paints comprise the major end markets for special purpose coatings, as shown in Figure 17. Far fewer end-market segments and subsegments comprise the special purpose coatings market segment than is the case with industrial OEM coatings, but special purpose coatings typically command higher overall margins than industrial OEM coatings.
FIGURE 17: Major subsegments of the U.S. special purpose coatings market segment, by value (2026e)
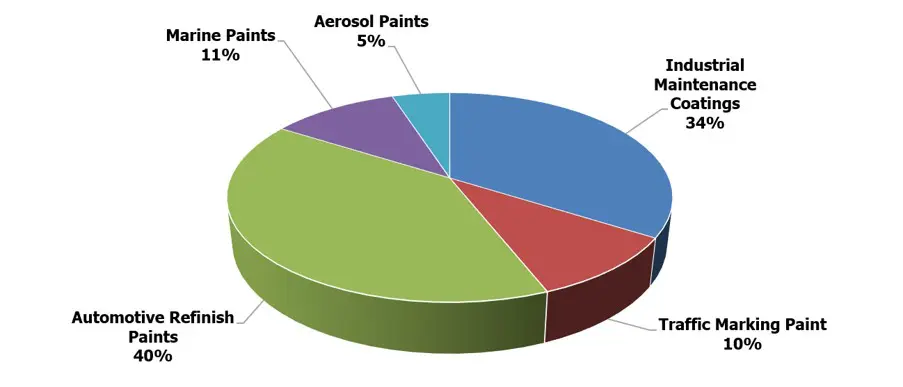
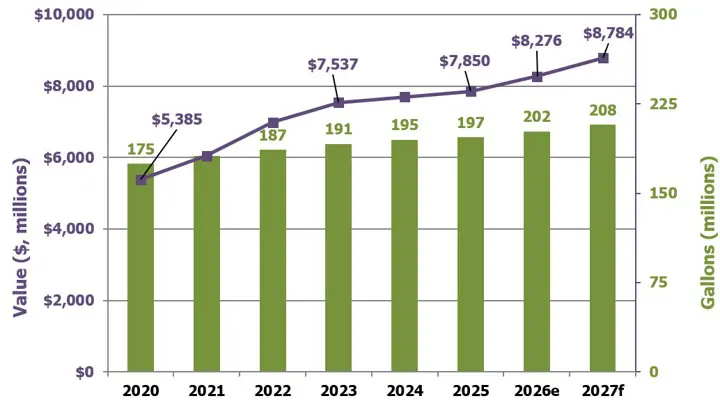
In 2025, special purpose coatings grew in value to $7.9 billion, representing 2.0% growth compared to 2024, while volume grew from 195 to 197 million gallons at a rate of 1.1%. In 2026e, we are expecting an increase in value of special purpose coatings from $7.9 billion to $8.3 billion, as volume increases from 197 to 202 million gallons (Figure 18). This represents a forecasted sales increase of 5.4% and an increase of 2.6% in volume. In 2027f, we are forecasting $8.8 billion on 208 million gallons, for an increase in value of 6.1% and in volume of 2.7%.
FIGURE 18: U.S. special purpose coatings, by volume and value (2020-2027f)
Sources: The ChemQuest Group, Inc., estimates
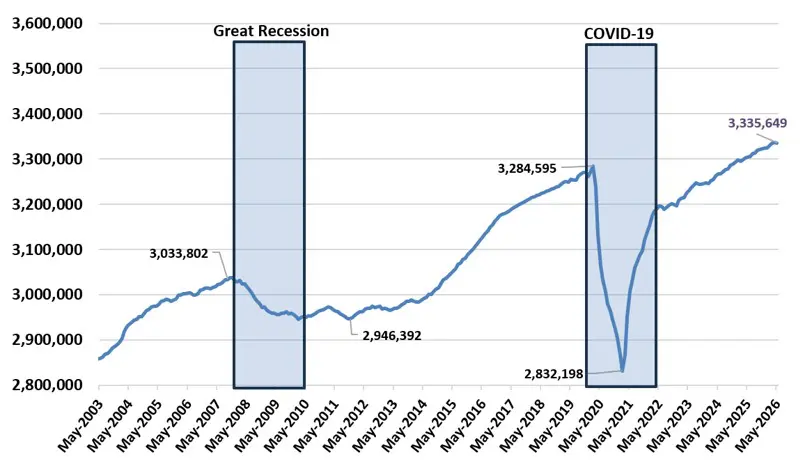
Automotive refinish coatings and industrial maintenance/protective coatings are the largest segments comprising special purpose coatings. The former segment tends to track accident rates, total miles driven (Figure 19), automotive sales, and size of the car parc (the total number of registered vehicles in use at any given time). The latter directly tracks industrial construction and maintenance of medium- and heavy-duty facilities such as wastewater treatment plants and petrochemical facilities—especially oil and gas (O&G), which represents approximately 30% of protective coatings volume—and infrastructure refurbishment. Historically, it also tracked (albeit indirectly) global crude oil prices, which ranged from $55–$76 per barrel in 2025 for West Texas Intermediate (WTI) to $107 per barrel during H1 2026e. Given the geopolitical fallout surrounding the price of crude oil, and the subsequent increase in both oil drilling and transportation equipment, it is likely that this will have a salubrious effect on the demand of industrial maintenance/protective coatings over the coming five-year period.
FIGURE 19: Moving 12-month total vehicle miles traveled (millions of miles), May 2003-May 2026
Sources: St. Louis Federal Reserve; The ChemQuest Group, Inc.
Automotive refinish coatings sales are typically growing slightly or declining slightly during any given year, and predictions for the future typically either foresee slight growth or slight decline. The reason for such equivocal forecasts is that this market sector is constantly teetering on the brink of growth versus decline, depending upon which of a number of conflicting factors are in the ascendancy at any given time. Factors that tend to reduce automotive refinish coatings sales include (but are not limited to) improved education of the populace with regard to safer driving habits and the advent of safer, “smarter” cars that help with accident reduction and damage mitigation. This is accomplished with a continuous parade of collision-avoidance devices and systems such as energy-absorbing bumpers, back-up cameras, adjacent vehicle indicators, and automatic controls that keep cars from accidentally crossing the center line.
On the other side of the coin, increased safety measures are frequently countered by factors that favor increased usage of automotive refinish coatings—factors such as drivers talking, texting, and glancing at GPS screens while driving; increasing disposable incomes; changing lifestyles and buying behaviors; and demand for luxury vehicles, including crossovers and SUVs. This is not because either crossovers or SUVs—or their drivers—are more accident-prone than other cars and their drivers, but because luxury car owners tend to have scratches and minor dings repaired more readily than nonluxury vehicle owners.
U.S. sales of automotive refinish coatings were $3.16 billion on 41.0 million gallons in 2025, down by 0.4% in value and 2.1% in volume over 2024. In 2026e, we expect to see an increase to $3.33 billion (+5.6%) on 41.6 million gallons (+1.5%). For 2027f, we are projecting sales of $3.55 billion (+6.6%) on 42.6 million gallons (+2.4%). While it is true that volume growth has been challenged in recent years as a result of declining claims, this has been compensated with increased claim amounts resulting from increased vehicle complexity, as well as an increase in total loss claims, compared with repairs.7
The industrial maintenance (IM) and protective coatings market segment represented 63.6 million gallons valued at $2.67 billion in 2025, an increase from 2024 of 3.1% by volume and 5.1% by value. We are predicting an increase in volume of protective coatings of 2.5% and an increase in value of 5.1% in 2026e, representing 65.2 million gallons valued at $2.81 billion, driven largely by construction and infrastructure. Going into 2027f, we anticipate growth over 2026e of 6.5% to $2.98 billion in value and 2.5% growth in volume to 66.8 million gallons.
Overall Industry Expectations for 2026e
At the end of the day, 2025 was a somewhat disappointing year for many producers in the U.S. coatings industry. Compared to 2024, volume was down 1.1%, attributed to the decline in architectural volume between 2024 and 2025, although value was up slightly by 0.6%. Because pricing outpaced volume, it is perhaps tempting to assume that coatings producers were able to keep ahead of raw material increases at an appropriate pace. While this may or may not be the case across the board, it was clearly the case on a producer-by-producer basis.
We estimate that 2026e will see an increase in value of the U.S. paint and coatings market by 3.5%, and volume will increase by 0.6%. The total value of the U.S. market is expected to be $35.3 billion on 1.33 billion gallons in 2026e. Our assessment is that the U.S. paint and coatings industry remains large and relatively healthy—and the outlook for 2027f suggests that growth will continue at a slightly faster pace than in 2026e. We currently foresee a 2.2% growth in volume and a 4.5% growth in value in 2027f, representing 1.36 billion gallons valued at $36.9 billion. This estimate takes into consideration a heightened appreciation for the damage that geopolitics can do to supply chains, but it is neither a “best-case scenario,” nor a “worst-case scenario.” Rather, it represents what we consider to be a realistic estimate of a range of scenarios that may or may not take place in the period 2026-2027.
Going Forward
In the changing world in which we live, in-house assets are increasingly challenged and easily overwhelmed, R&D pipelines are too long, tactical concerns relegate new product development to the back burner, global supply chains are in continual danger of disruption, and research staff is operating under the negative effects of stress. Strategic product development must either involve the expansion of current R&D staff or the use of outside know-how and expertise to augment internal efforts. Independent third-party individual knowledge experts, strategic consulting firms, and technology organizations are able to bring extensive knowledge in multiple fields of specialty chemicals to bear on the advancement and cross-fertilization of technology at both raw material suppliers and coatings producers. It is well worth doing “whatever it takes” to access third-party expertise to help manufacturing companies embrace a wider world of technology experience and know-how and deal as smoothly as possible with global supply chain disruptions and evolving trade routes and alliances.
When all is said and done, it is effective strategy, the offspring of careful planning coupled with a wide-eyed and honest appraisal of the overall global situation, that will separate the most successful paint and coatings producers from the less successful. Those raw material suppliers and paint and coatings producers that create their strategies and new products by working with outside partners—strategic business advisers, technology consultants, independent laboratories, universities, individual subject matter experts, or all of the foregoing—are going to have an advantage in a world that is characterized by knowledge creation moving at the speed of light but hampered by geopolitical stumbling blocks than are those raw material suppliers and paint and coatings producers that decide to keep everything “in house,” although both approaches have the potential to produce successful “Forward Plans.” The only approach to the future that will most definitely not work is “business as usual.”
George R. Pilcher is vice president at the ChemQuest Group, ChemQuest Technology Institute, and ChemQuest Powder Coating Research. For more information, visit chemquest.com or email George at gpilcher@chemquest.com.
References
- Bharadwaj, A.; DeSapio, D.; Gilbert, M.; Lang, N; Maggard, K.; McAdoo, M.; Morten, S.; and Ulrich, P., “Trade in Transition: How to Prepare for a Patchwork World Order,” Global Trade Report 2026, Boston Consulting Group, January 2026, https://www.bcg.com/publications/2026/how-prepare-patchwork-world-order.
- BRICS + currently has 11 full members: Brazil, China, Egypt, Ethiopia, India, Indonesia, Iran, Russia, Saudi Arabia, South Africa, and the United Arab Emirates. It currently has 10 “Partner Countries,” admitted on a pathway to potential future membership: Belarus, Bolivia, Cuba, Kazakhstan, Malaysia, Nigeria, Thailand, Uganda, Uzbekistan, and Vietnam.
- Swain, S.’ Jakhar, D.; Bhattacharya, S., “The Rise of Plurilateralism: Challenges, Opportunities and India’s Emerging Role in Global Governance,” International Journal of Advanced Research, 13(07), July-2025, 01-07, pp. 1-7.
- U.S. Energy Information Administration, “Top Ten Producers of Crude Oil and Lease Condensate, 2025,” June 2026, eia.gov/todayinenergy/detail.php?id=65624 (accessed July 22, 2025).
- “U.S. Utilization of Refinery Capacity,” YCharts, ycharts.com/indicators/us_operable_crude_oil_distillation_capacity#:~:text=Level%20Chart,long%20term%20average%20of%2089.64%25.
- U.S. Energy Information Administration, “U.S. refinery capacity largely unchanged as of January 2026,” June 2026, eia.gov/todayinenergy/detail.php?id=65624 (accessed July 22, 2025).
- Mitsch, F.; Gazieva, A., “Quick Paints, Coatings, Adhesives Report: Uncertain Raw Material Backdrop,” Chemicals Industry Update, Fermium Research, July 15, 2026.